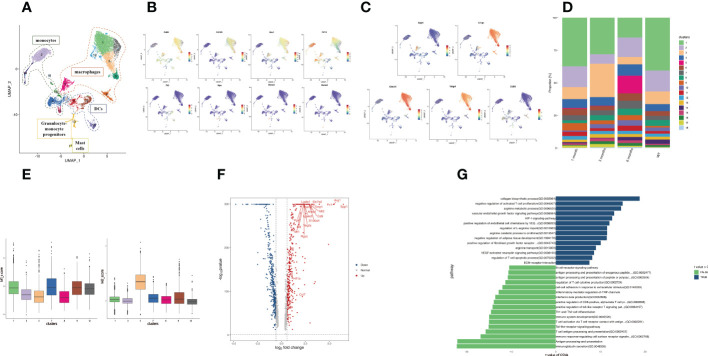
Figure 3.
Profiling of SPP1+ macrophage function. (A) The UMAP plot displays 18 myeloid cell subclusters; (B) The expression levels of specific markers for each myeloid cell type are plotted onto a UMAP map; (C) The expression levels of specific markers for each macrophage subtype were plotted onto the UMAP map; (D) The histogram indicates the proportions of myeloid cell populations in each infection period; (E) The box plots show the classification of macrophage clusters into M1 and M2. (F) The volcano plot of DEGs between the SPP1+ and C1QC+ macrophages. Upregulated and downregulated genes are highlighted in blue and red, respectively; (G) The bar plot depicting the GSVA results of SPP1+ and C1QC+ macrophage differential genes.

