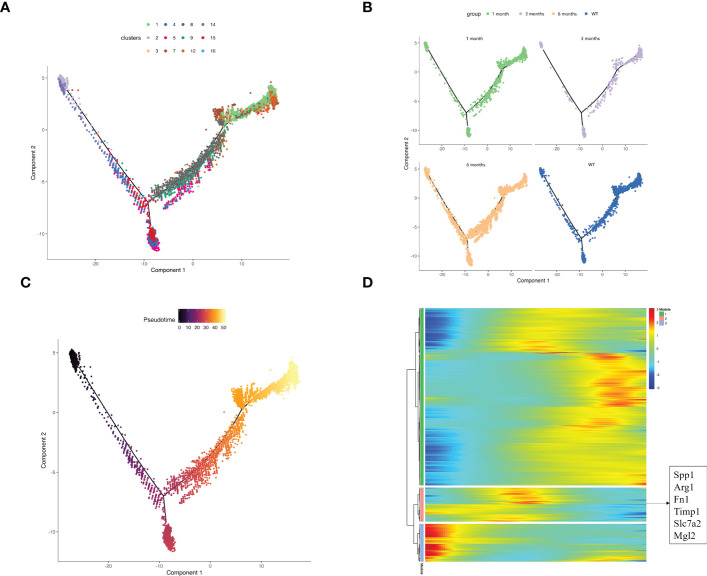
Figure 5.
Exploring the source of SPP1+ macrophages based on pseudo-time analysis using Monocle2. (A) The pseudo-time trajectory plot represents macrophage and monocyte development. The dot color represents the cluster number; (B) The pseudo-time trajectory plots demonstrate the sample distribution along the trajectory. The dot color represents the group; (C) The developmental pseudo-time of monocytes and macrophages was inferred by Monocle analysis. The dark to bright color key indicates cell differentiation progression and the dark to bright color key progresses from the monocytes to macrophages; (D) The heatmap displays the SDE genes during the trajectory. The blue-to-red color key indicates low to high relative expression levels.

