FIGURE 5.

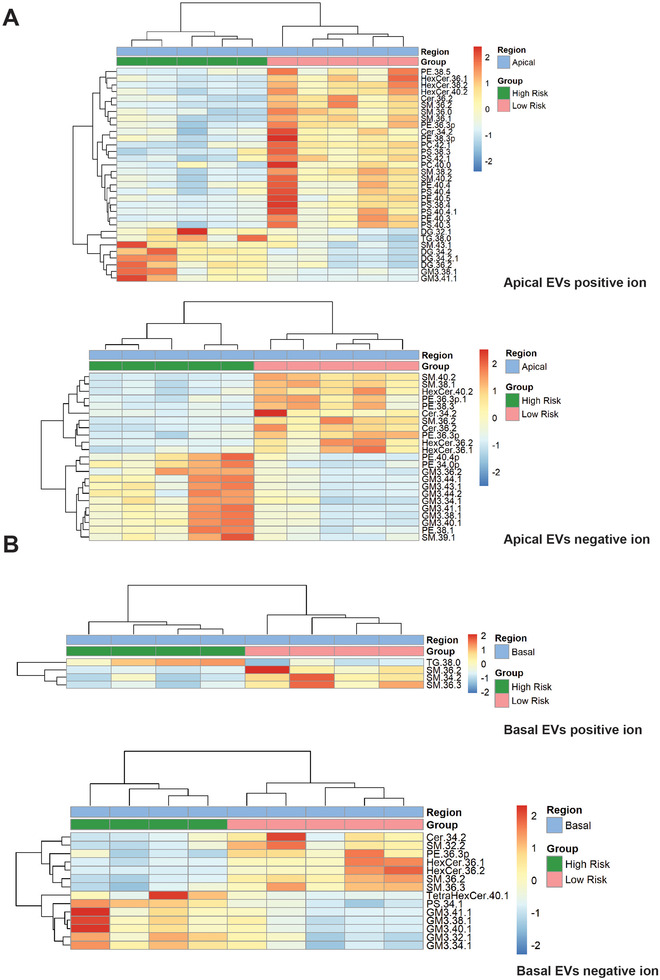
Lipidomics analysis of low and high‐risk RPE apical and basal EVs. Heatmaps show supervised clustering of statistically significantly changed lipids from positive and negative ion mode analyses, based on t‐test and p value < 0.05 cutoff.

Lipidomics analysis of low and high‐risk RPE apical and basal EVs. Heatmaps show supervised clustering of statistically significantly changed lipids from positive and negative ion mode analyses, based on t‐test and p value < 0.05 cutoff.