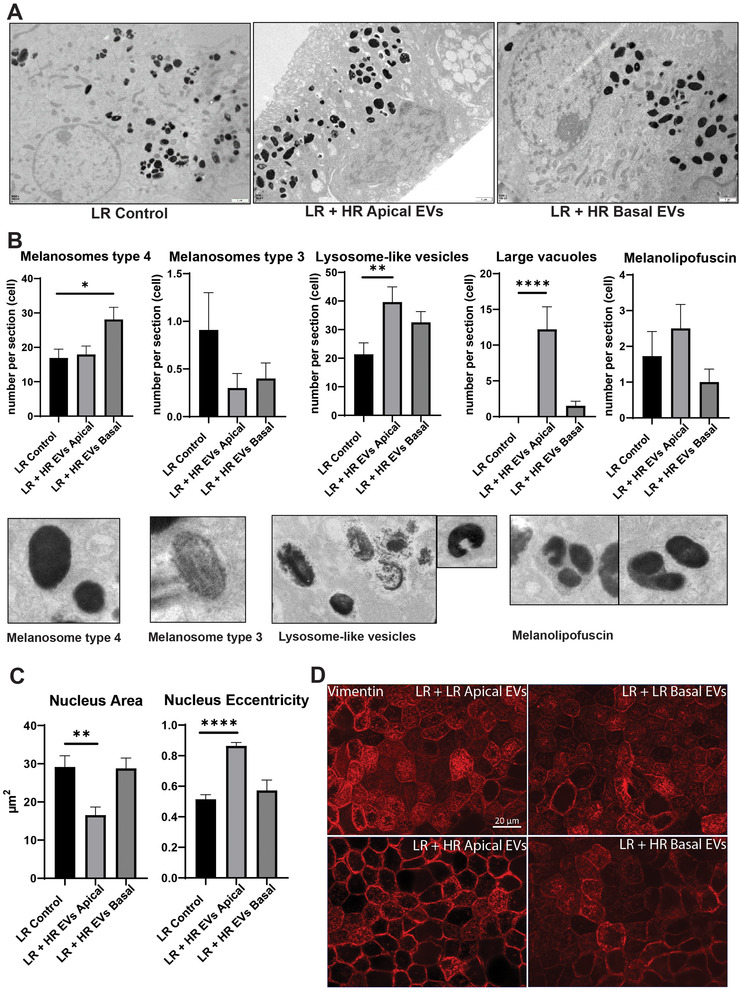
FIGURE 8.

High‐risk RPE EVs confer disease phenotype to control RPE cells. (A) RPE ultrastructural features on TEM post‐EV exposure. LR Control—low risk PBS treated. (B) Melanosomes, vesicles with visible melanin degradation (melanolysosomes or lysosome‐like vesicles), large vacuoles and melanolipofuscin granules were quantified with Mean + SEM presented. Data was analysed for normality, followed by ANOVA and Dunn's multiple comparisons test. *p < 0.05, **p < 0.01, ****p < 0.0001. (C) Parameters of the cell nuclei were analysed with MIB Helsinki software, followed by statistical analysis (normality test followed by ANOVA with Dunnett's or Dunn's multiple comparisons test where appropriate). Mean + SEM shown, **p < 0.01, ****p < 0.0001. (D) Immunofluorescence analysis of vimentin expression in low‐risk RPE treated with low/high risk apical/basal EVs. Note the pronounced loss of intermediate filaments in high‐risk apical EVstreated RPE cells.
