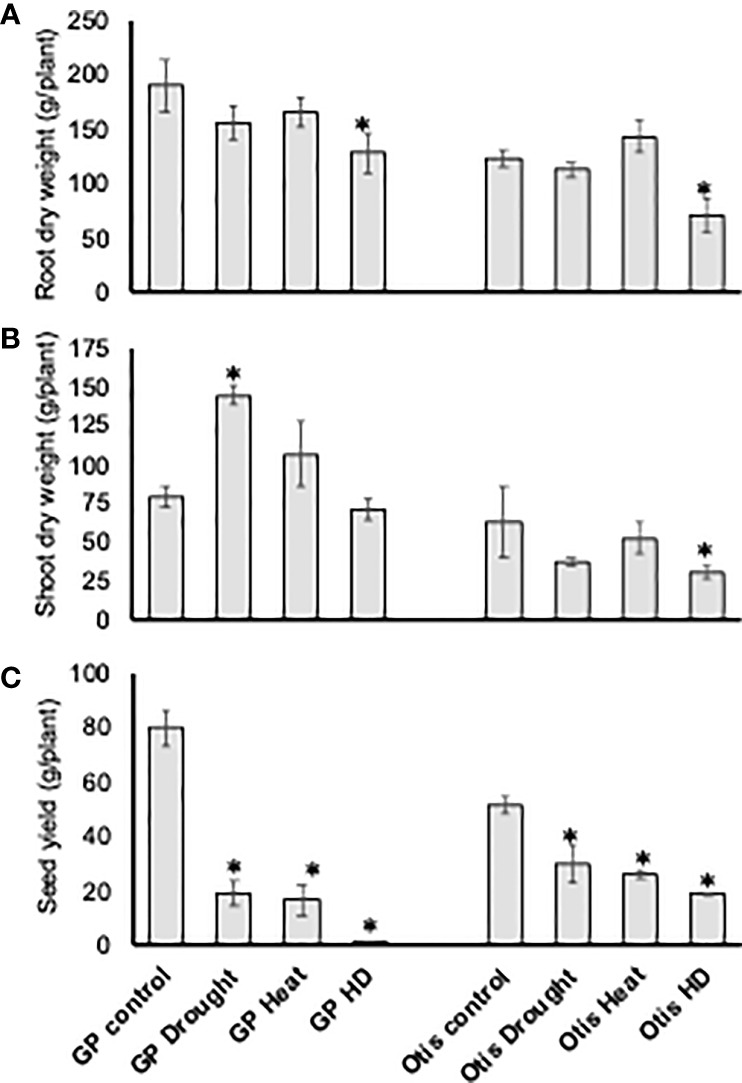
Figure 2.

Analysis of dry root biomass (A), shoot biomass (B), and seed yield (C) in response to heat, drought and combined stress in Golden Promise and Otis. Error bars represent standard deviations of the mean of five observations from five different plants for each treatment (n = 5). Statistically significant differences in measured traits when compared to non-stressed control plants are denoted by ‘*’ above the bars (*P-value <0.05).
