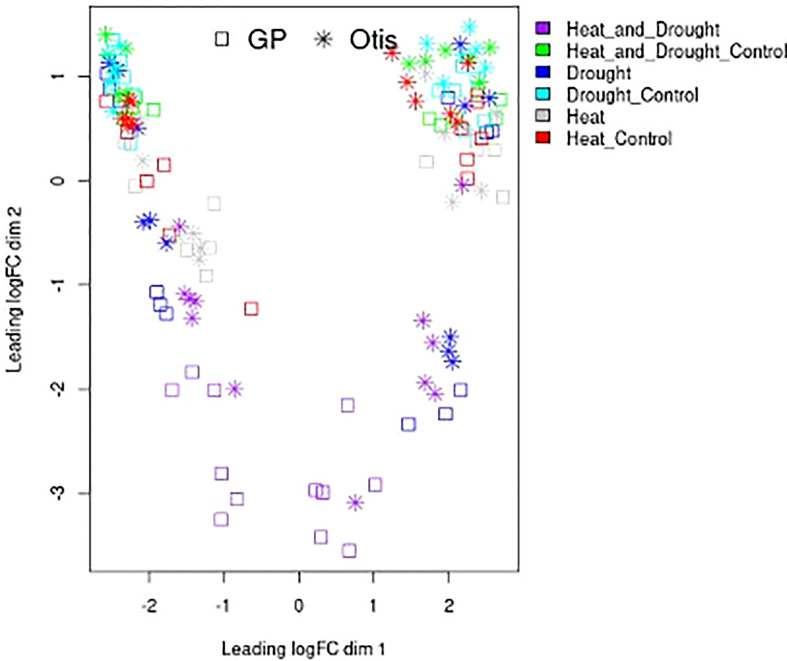
Figure 4.
Multidimensional scaling plot of replicated RNA-Seq samples. Features on the plot represent libraries of control, drought, heat and combined stress treatments from flag leaves and head tissues collected after 1 day and 5 days of treatment. Spatial arrangement of the various RNA-seq libraries is based on their calculated distances estimated using root-mean-square deviation for the top 500 genes with the largest standard deviation among all samples. The square represents GP libraries while the * represent Otis libraries. The color code for the heat, drought and combined heat and drought and corresponding controls is shown on the right.

