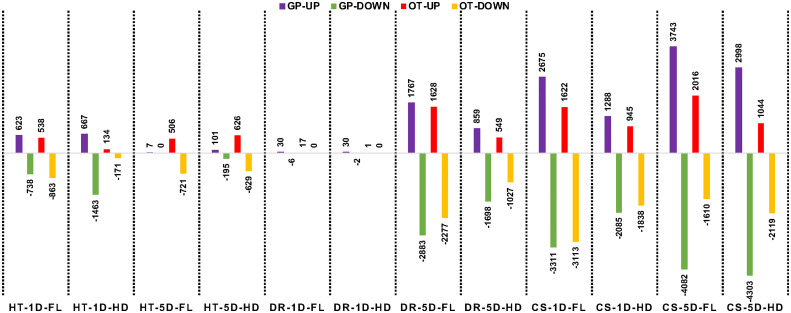
Figure 5.
Number of differentially expressed genes in the flag leaf (FL) and head (HD) tissues at 1-day after stress (1D) or 5 days after stress (5D) in Golden Promise (GP) and Otis (OT) observed in response to heat (HT), drought (D), and combined stress (CS). Upward pointing bars represent upregulated genes and the downward facing bars represent the down regulated genes. Normalized counts for a gene from a stressed sample library is divided by the corresponding normalized counts for the same gene from the matched control sample library. A log2 > 1.0 and FDR of 0.05 was used as the cutoff to call a gene as being differentially expressed.

