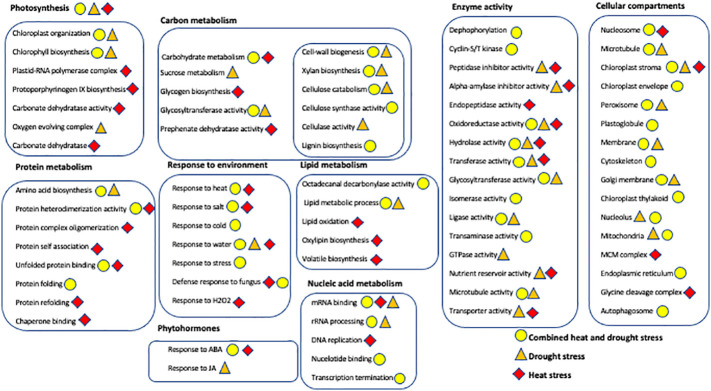
Figure 7.
Overview of the Gene Ontology enrichment analysis showing the major biological processes, molecular functions, and cellular compartments of differentially expressed genes from leaves and head of Golden Promise and Otis in response to drought (brown triangles), heat (red diamond) and combined stress (yellow circle). Metabolic processes, molecular functions and genes encoding for proteins with specific activities are grouped within boxes. Only statistically significant GOs (P-value <0.001 and FDR<0.05) and those containing three or more DEGs were used for creating this illustration.

