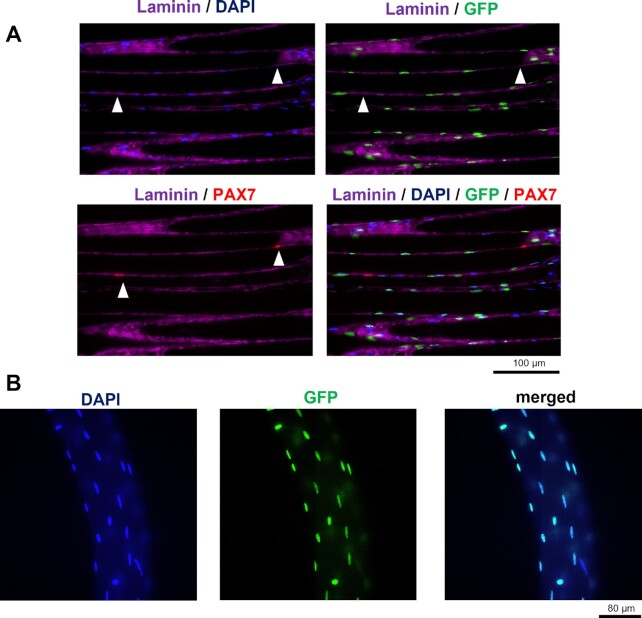
Figure 3.
Representative microscopic images of the validation of the HSA-GFP skeletal muscle after DOX treatment. (A) Longitudinal sections of TA muscle from the HSA-GFP mouse. DAPI = total nuclei, GFP = myonuclei, PAX7 = SCs. The GFP signal from myonuclei does not overlap with the PAX7 signal from SCs. Scale bar = 100 μm. (B) Single-fiber images of EDL muscle from the HSA-GFP mouse with GFP-labeled myonuclei. Scale bar = 80 μm.

