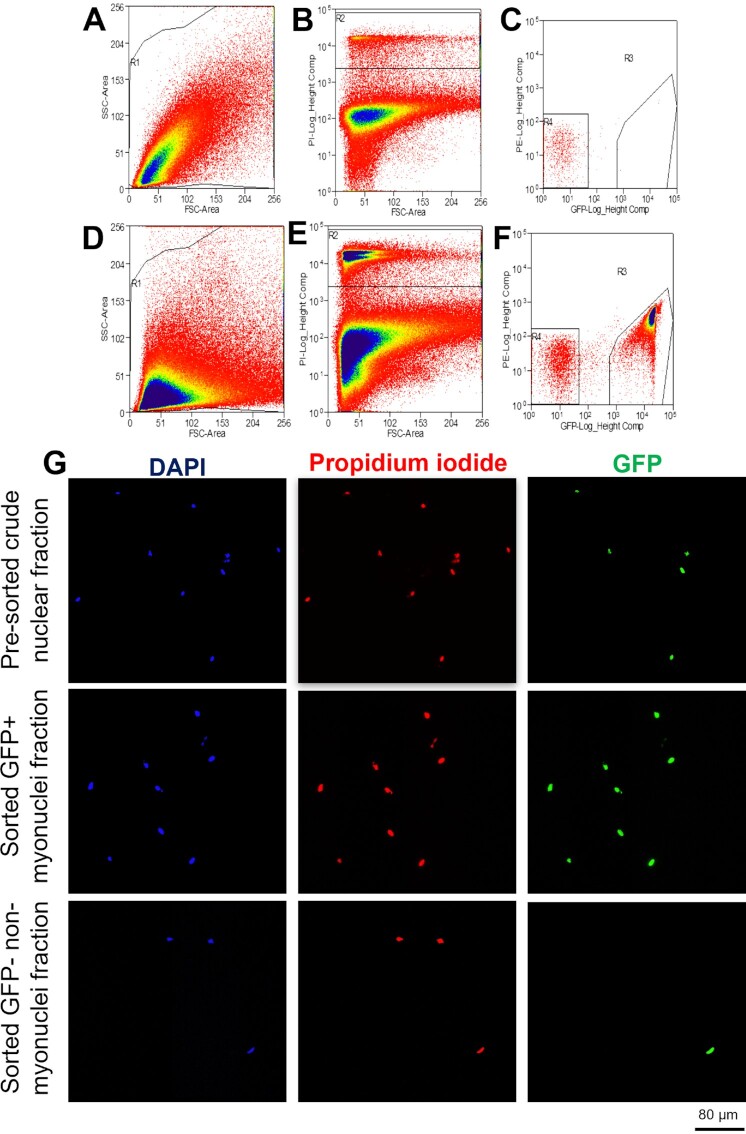
Figure 4.
Fluorescence activated cell sorting (FACS) gating strategy for myonuclei and nonmyonuclei sorting from skeletal muscle homogenates. Upper panel = gating strategy for muscle homogenates from noninduced HSA-GFP control mice. Lower panel = gating strategy for muscle homogenates from DOX-treaded HSA-GFP mice. (A, D) Scatterplot of forward scatter (area) by side scatter (area) of muscle homogenate. (B, E) Scatterplot of PI (PI, height) by forward scatter (area). Gate R2 indicates the total nuclear population. (C, F) Scatterplot of PI (PI, height) by GFP (height). Gate R3 indicates myonuclei (PI+/GFP+); gate R4 indicates nonmyonuclei (PI+/GFP-). (G) Representative images of pre-sorted crude nuclear fraction; sorted myonuclear fraction (PI+/GFP+) and sorted nonmyonuclear fraction (PI+/GFP-). Scale bar = 80 μm.

