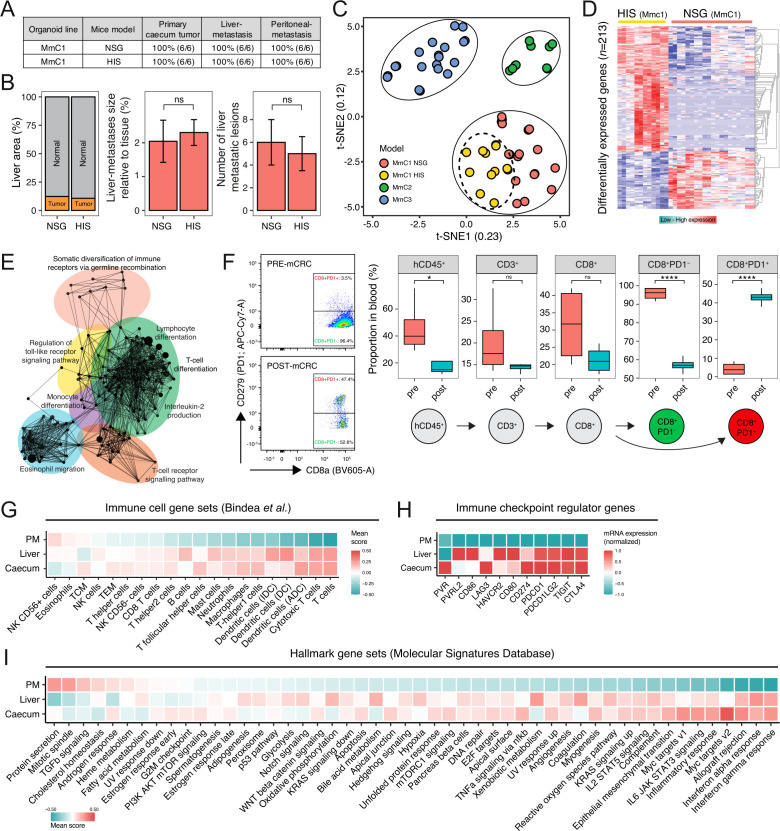
Figure 2.
Preservation of metastasis patterns in humanized mice despite extensive influx of immune cells. (A) Comparison of NSG and HIS (humanized immune system) MmC1 mice models for tumor outgrowth and liver metastasis, and peritoneum metastasis, two independent experiments. (B) Histological quantification (hNucleoli) in NSG and HIS livers of MmC1 models, two independent experiments, n=6 mice per group. Mann-Whitney; ns, not significant. (C) t-SNE projection of RNA sequencing data of in vitro/vivo samples. (D) Differential gene expression analysis between NSG and HIS mice. Red indicates upregulated genes and blue vice versa. (E) Functionally grouped network with gene ontology terms as nodes of upregulated genes in HIS model (ClueGO Cytoscape). (F) Circulating immune populations in blood before/after implantation in HIS mice. Proportion of parent population shown (%). Mann-Whitney: *p<0.05; ****p<0.0001; ns, not significant. (G) Relative scores of immune cell gene sets,31 (H) immune checkpoint regulator genes, and (I) hallmark gene sets, representing biological states or processes in RNA sequencing data of primary cecum tumor, liver metastases and peritoneum metastases derived from HIS mice samples. Color indicates expression: red=high; blue=low. HIS, human immune system; mCRC, metastatic colorectal cancer; PD-1, programmed cell death protein-1, t-SNE, t-distributed stochastic neighbor embedding.

