Figure 4.
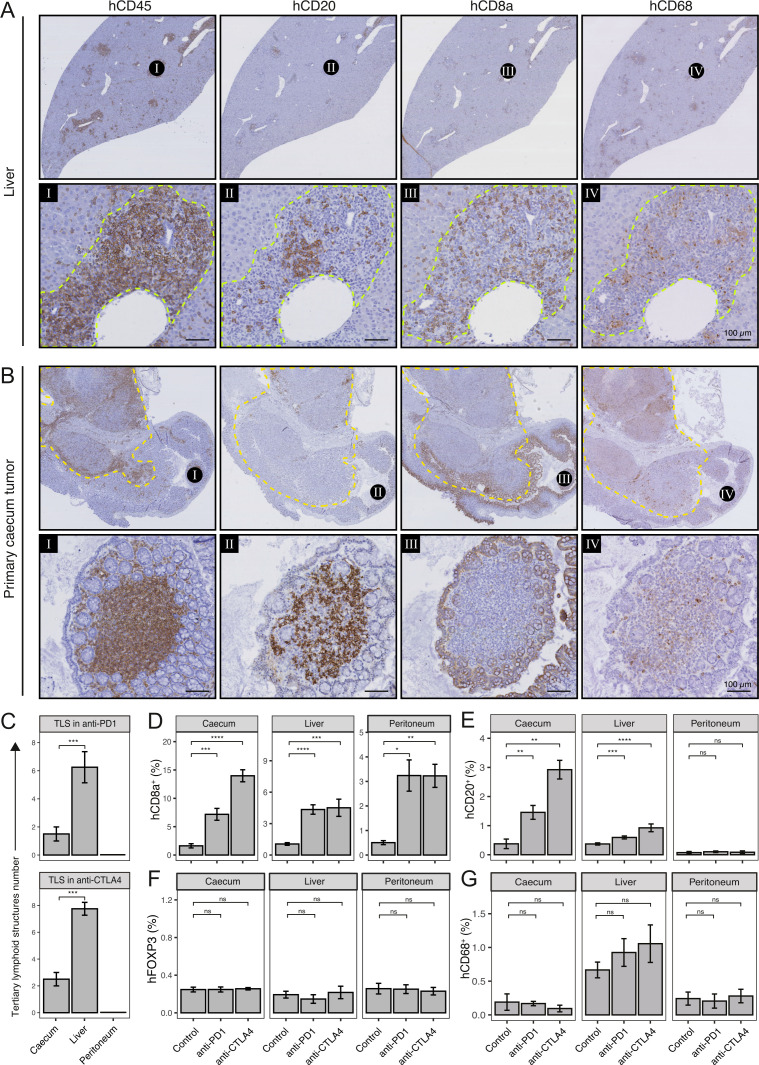
Immune checkpoint blockade induces formation of tertiary lymphoid structures (TLS) and distinct tumor-infiltrating lymphocytes (TIL) populations. (A) Histological examples of TLS in liver and (B) cecum of anti-CTLA-4-treated mouse. Spatial information of immune cells (hCD45), B cells (hCD20), Cytotoxic T cells (hCD8a) and macrophages (hCD68) in TLS are shown. Dashed yellow line indicates primary tumor. Scale-bar of area zoom 100 µm. (C) Number of TLS in cecum, liver, and peritoneum of anti-PD-1 (top) and anti-CTLA-4-treated mice (bottom). (D) Cytotoxic T cell (hCD8a), (E) B cell (hCD20), (F) regulatory T cells (hFOXP3), and (G) macrophages (hCD68) infiltration (% relative to tissue) in cecum, liver, and peritoneum. Mann-Whitney: *p<0.05; **p<0.01; ***p<0.001; ****p<0.0001; CTLA-4, cytotoxic T-lymphocytes-associated protein 4; ns, not significant; PD-1, programmed death ligand-1, TIL, tumor-infiltrating lymphocytes.

