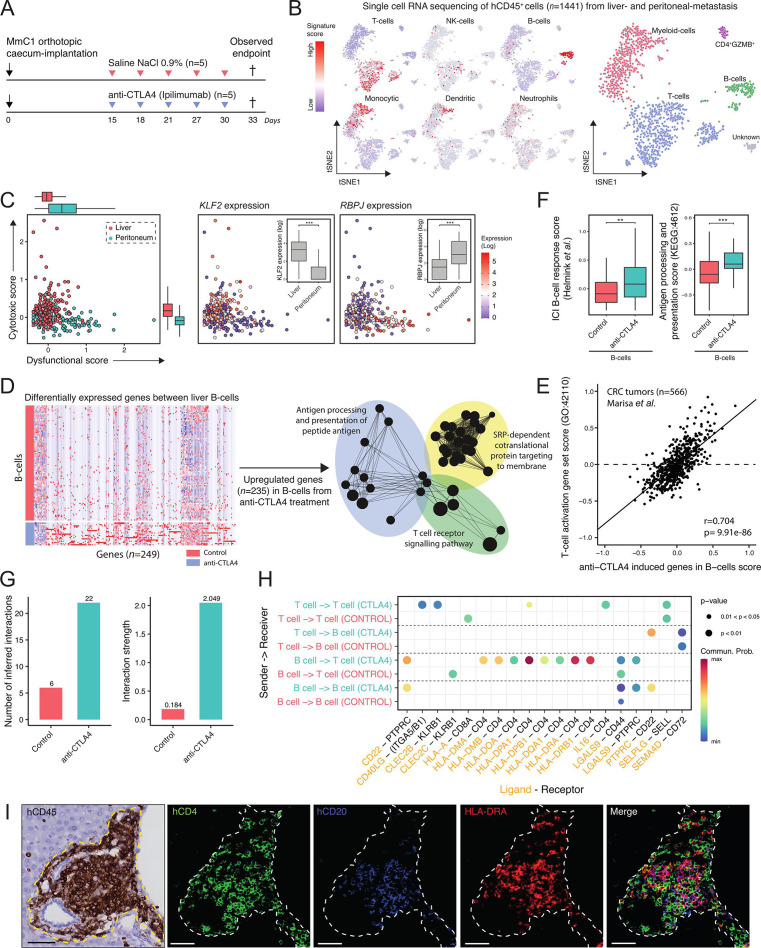
Figure 7.
Immune checkpoint blockade induces site-specific transcriptional reprogramming in T cells and the formation of antigen-presenting B cells in TLS. (A) Experimental protocol of treating human immune system mice with anti-CTLA-4 (200 µg, i.p.), starting post 15 day’s orthotropic cecum-implantation with 3 days interval. All animals are sacrificed at the first observed endpoint (t=33 days) of control mice. Immune cells (hCD45+) from liver metastasis and peritoneum metastasis were sorted for single-cell RNA sequencing. i.p. intraperitoneal injection. (B) t-SNE projection of single-cell RNA sequencing log-transformed counts on all detectable genes in hCD45+ cells. Scores of microenvironment cell populations10, including cell types: T cell, NK cell, B cell, monocytic, dendritic and neutrophil. (C) Cytotoxic-scores and dysfunctional-scores50 for T cells of liver (red) and peritoneum (blue) tissue. Expression (log) of associated transcription-factors KLF2 and RBPJ with cytotoxic- and dysfunctional scores, respectively. Mann-Whitney: **p<0.01; ***p<0.001. (D) Differential gene expression analysis between B cells from control and anti-CTLA-4-treated mice. Red and blue colors indicate upregulated and downregulated genes, respectively. Functional network analysis using ClueGO Cytoscape and gene ontology terms as nodes of upregulated genes (n=235) in anti-CTLA-4-treated derived B cells. (E) Positive correlation with anti-CTLA-4 induced genes in B cells signature and ‘T cell activation’ signature in a CRC cohort.32 (F) Boxplots showing expression of a B cell gene signature associated with response to ICB therapy, and genes in the ‘antigen processing and presentation’ pathway (KEGG: hsa04612) in B cells in control and anti-CTLA-4-treated mice. (G) Inference and analysis of cell–cell communication using CellChat.51 Bar plot represents the total number of inferred interactions (left) and interaction strength (right) of B and T cells derived from livers of control (red) or anti-CTLA-4 treated (blue) mice. (H) Bubble plot representing the communication probabilities for the identified ligand-receptor interactions between cell groups. (I) Histological analysis of HLA-DRA+ B cells juxtaposed to CD4+ T cells in TLS in anti-CTLA-4-treated mouse livers. Scale-bar 50 µm. CRC, colorectal cancer; CTLA-4, cytotoxic T-lymphocytes-associated protein 4; ICB, immune checkpoint blockade; i.p., intraperitoneal; NK, natural killer; TLS, tertiary lymphoid structures, t-SNE, t-distributed stochastic neighbor embedding.

