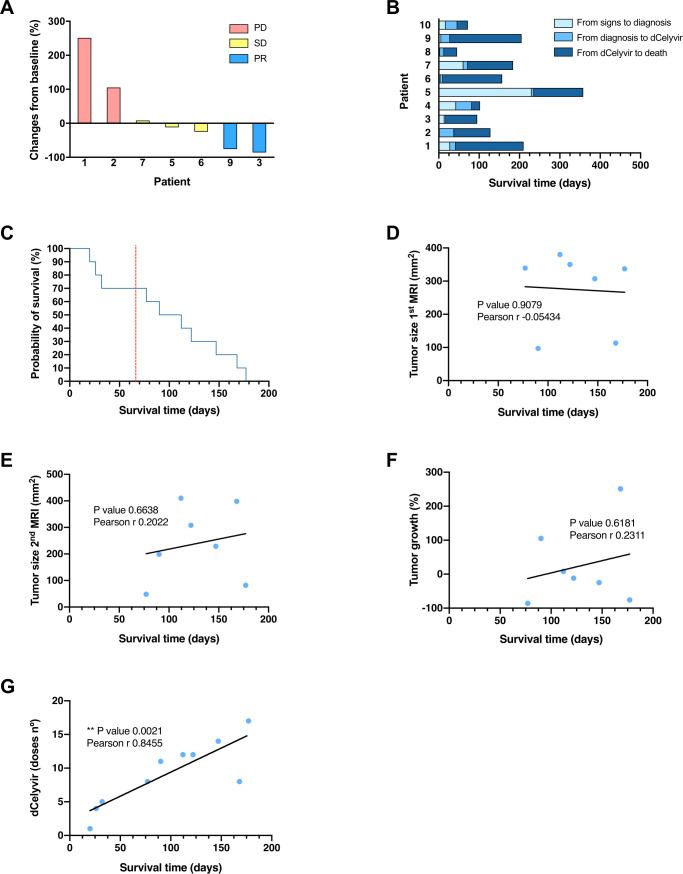
Figure 2.
Tumor growth and survival time from the dCelyvir-treated patients. (A) Waterfall plot showing changes in tumor size. Tumor growth from baseline (first MRI) to 2 months after starting the dCelyvir treatment (second MRI) is shown for each patient. (B) Survival time. Bar plot showing the total survival time for each patient. The days from symptom onset to diagnosis, from diagnosis to starting dCelyvir treatment, and from treatment to death are indicated for each patient. (C) Survival analysis. Kaplan-Meier curve showing the probability of survival for dCelyvir-treated dogs (blue line) starting with day of treatment up to death. The dashed red line indicates the MST according to the literature and the historical cases treated with resective surgery. (D–G) Correlation analysis between survival time and tumor size at first MRI (D), at second MRI (E), tumor growth (F), and dCelyvir dose (G) calculated by Pearson’s correlation coefficient (r). Individual values (blue dots) and regression lines are shown. **p<0.005. MST, median survival time; PD, progressive disease; PR, partial response; SD, stable disease.

