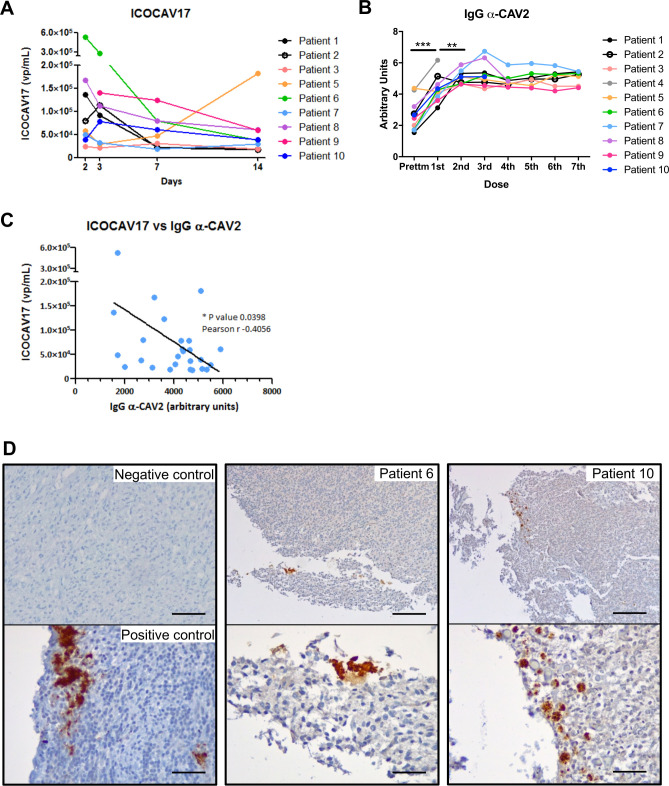
Figure 3.
Oncolytic virus and antibody response. (A) Adenovirus detection during follow-up. Adenovirus presence analyzed by quantitative PCR (qPCR) in peripheral blood is shown. Quantification time refers to the time after the first day of treatment (day 0). Individual values from each patient are shown. (B)Specific antibodies. IgG α-CAV2 quantified by solid phase ELISA in the serum of canine patients during dCelyvir treatments. A Wilcoxon test was performed (***p<0.0001; **p<0.005). (C)Correlation between oncolytic adenovirus and specific antibodies was calculated by Pearson’s correlation coefficient (r), using data from all available dogs up to the second week of treatment (14th day after treatment). Individual values (blue dots) and a regression line are shown. *p<0.05. (D)The presence of adenovirus inside gliomas analyzed by immunohistochemistry. Representative images showing adenovirus-positive cells (brown) on formalin-fixed, paraffin-embedded-positive control tissue, and tumor necropsies from patients 6 and 10. Scale bars: 50 µm (negative and positive controls), 200 µm (top patients) and 50 µm (bottom patients).

