Figure 5.
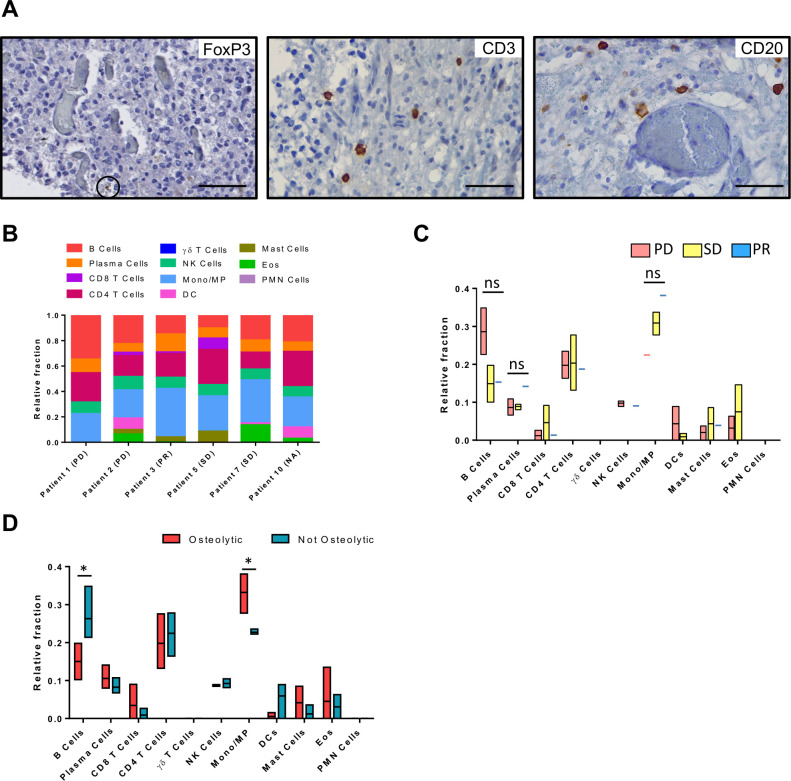
Intratumor immune microenvironment characterization after dCelyvir treatment. (A) The presence of immune cells inside gliomas analyzed by immunohistochemistry. Representative images showing immune cells (brown) on formalin-fixed, paraffin-embedded tumors at necropsies. Scale bars: 50 µm. (B) Relative fraction of 11 types of TILs in 6 dogs estimated with CIBERSORT. (C) Immune cell relative fraction from patients depending on their clinical benefit, after dCelyvir treatment. (D) Immune cell relative fraction from patients, comparing those that present an osteolytic pattern at CT imaging (osteolytic) and those that do not (not osteolytic). Statistic test: Two-way ANOVA and Bonferroni’s multiple comparison test; Alpha: 0.05; ns: not significant; *p<0.05. ANOVA, analysis of variance; DC, dendritic cells; Eos, Eosinophils; Mono/MP, Monocyte/Macrophages; PD, progressive disease; PMN, polymorphonuclear cells; PR, partial response; SD, stable disease; TILs, tumor-infiltrating lymphocytes.

