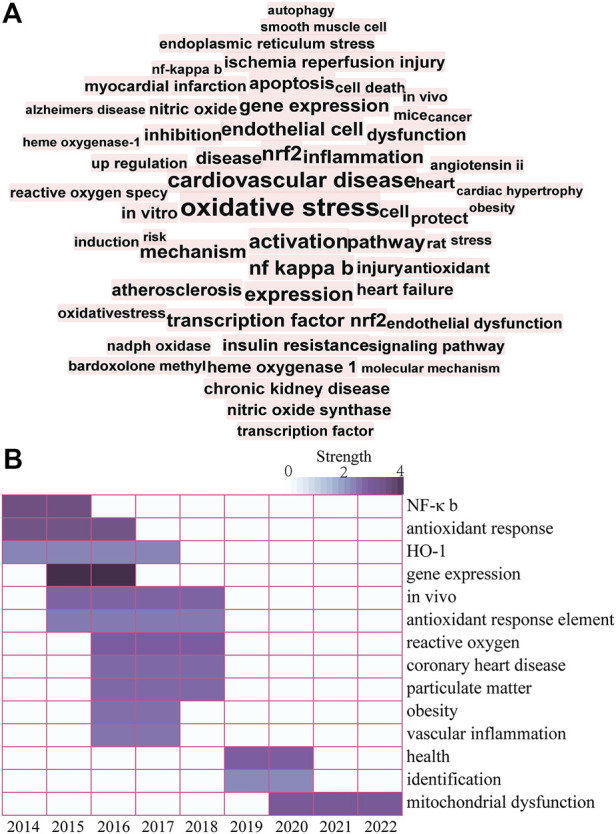
FIGURE 3.

(A) Keyword co-occurrence knowledge map. A larger and more centered font corresponds to the number of times a keyword appears. (B) Top 14 keywords with the strongest citation bursts. The color depth represents the strength value of keywords with the strongest citation bursts. Darker color corresponds to a larger strength value.
