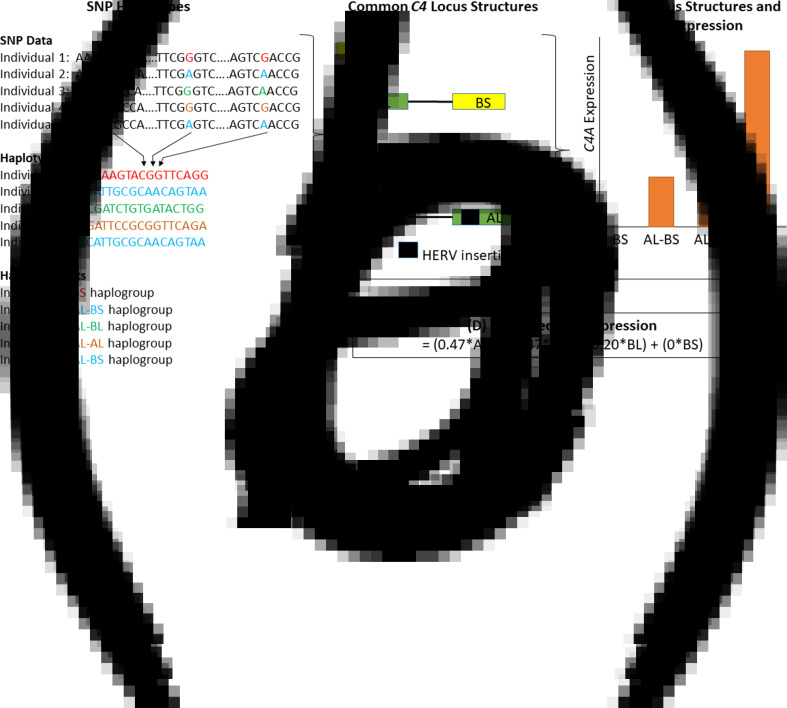
Fig. 1.
A schematic diagram of the methodology used to obtain predicted expression values for the C4A gene within brain tissue, as described by Sekar et al. (2016). First, (a) individual genotypes are determined and SNP haplotypes are then inferred from this data. (b) The SNP haplotypes can be grouped into haplogroups and each haplogroup corresponds to a specific C4 locus structure. Four of these structures are common (represented here) and 11 are less common (<10% frequency combined). HERV, human endogenous retroviral insertion. (c) Structures with higher copy numbers of C4A and C4L (both C4AL and C4BL) isotypes show higher C4A expression in brain tissue. (d) C4A gene expression can be predicted based on the data outlined in panels A–C. AL, AS, BL, and BS refer to the copy number of each of these isotypes in the C4 locus structure. Structures containing the AS combination are omitted from panels A to C since they are rare, with a frequency of approximately 1% (online Supplementary Table S1) (Sekar et al., 2016). This figure is a schematic and was not generated from actual genotype, expression or other data.

