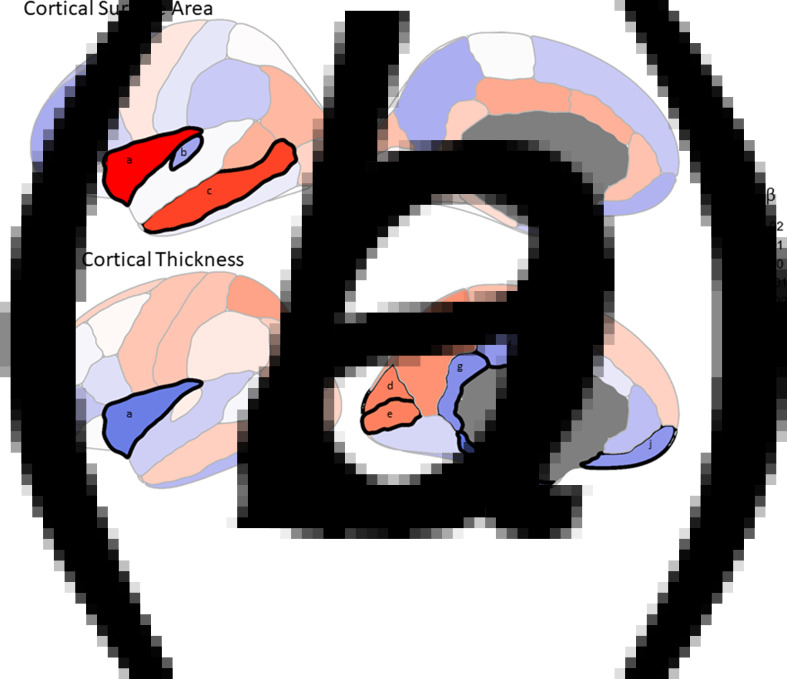
Fig. 3.
The effect of C4A expression on regional measures of (a) cortical surface area and (b) mean cortical thickness. The colors correspond to the standardized β (Std. β) coefficient for each brain region from the linear regressions. Black demarcations around a brain region indicate that it passes the multiple comparisons–corrected significance threshold of FDR <0.05. a, Insula. b, Transverse temporal. c, Middle temporal. d, Cuneus. e, Pericalcarine. f, Posterior cingulate. g, Isthmuscingulate. h, Parahippocampal. i, Entorhinal. j, Medial orbitofrontal.

