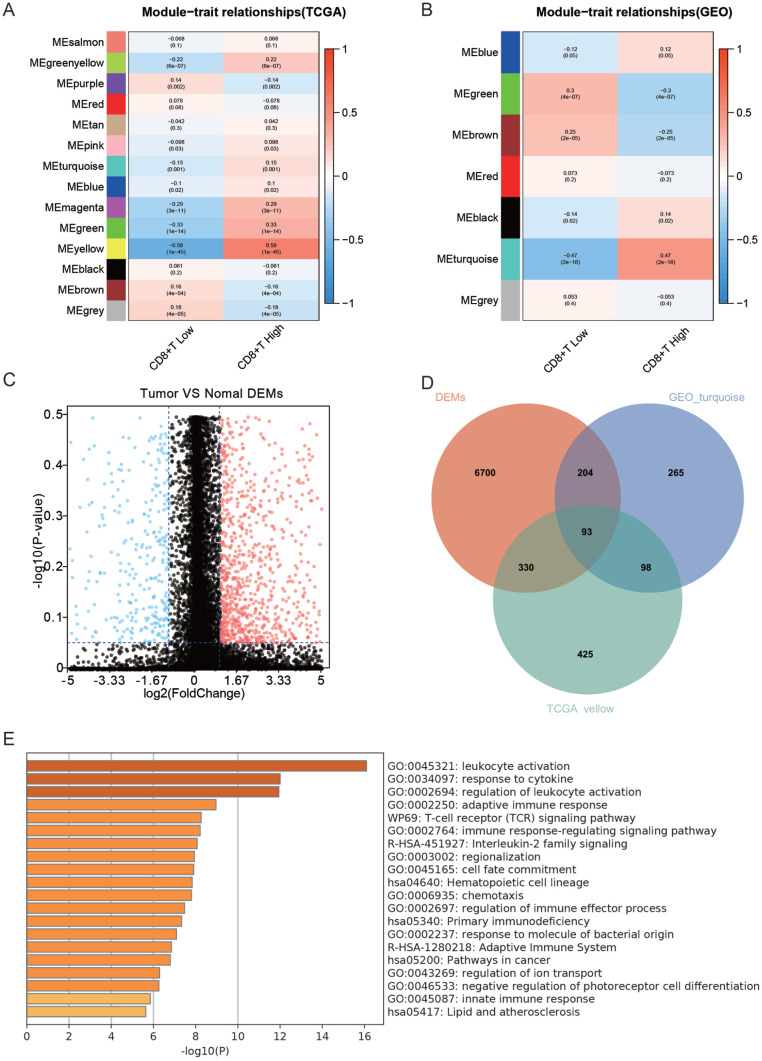
Figure 3.
Screening of differential genes linked with elevated CD8+ T cell infiltration (A) WGCNA analysis of modules linked with CD8+ T cell infiltration in TCGA dataset, (B) WGCNA analysis of modules linked with CD8+ T cell infiltration in GEO dataset, (C) volcano plot of differential genes between HNSC and normal tissues, (D) intersection of the green module in TCGA, purple module in GEO and of differential genes Wenn plot, and (E) functional enrichment analysis of intersecting genes.

