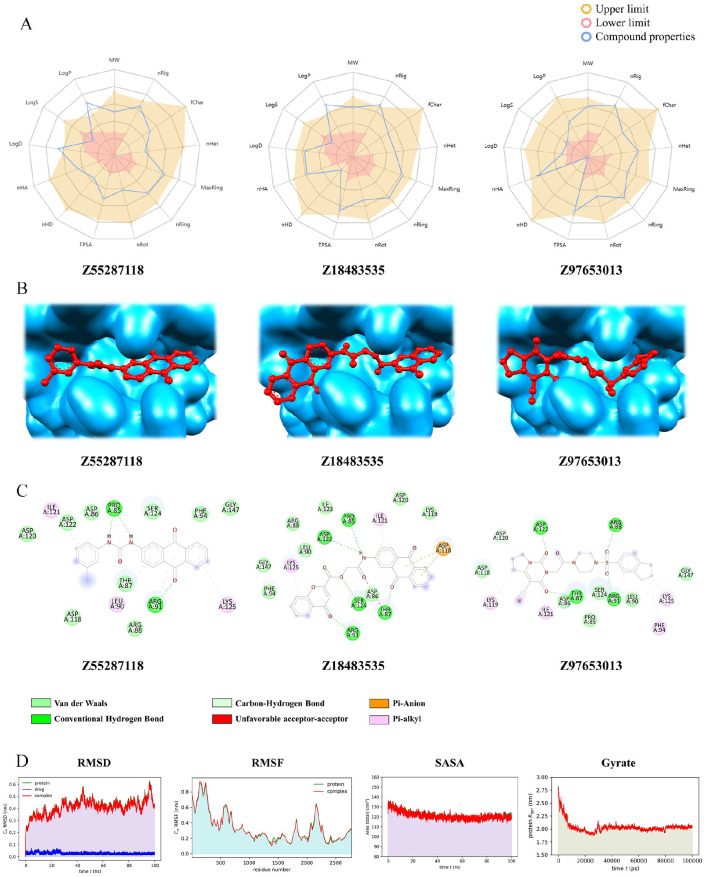
Figure 5.
Bioavailability radar, binding modes, molecular interaction, and Trajectory plots of MD simulation of the top hit compounds: (A) Oral-bioavailability profile of 3 hit ligands, where the yellow area indicates the upper limit, pink area denotes lower limit, and the blue lines signifies our compound properties; (B) hit ligands’ binding modes with receptor; (C) interactions of the hit compounds with receptor amino acid residues. The color bars represent the type of interaction formed between ligand and the receptor. (D) Plot of root mean square deviation (RMSD) (first column panel), root mean square fluctuation (RMSF) (second column panel), solvent accessible surface area (SASA) with respect to time (picoseconds) (third column panel), and radius of gyration (Rg) (fourth column panel) during MD simulation of A36Rreceptor in complex with the hit ligand Z55287118(red color) and unbound protein (green color). MD indicates molecular dynamic.

