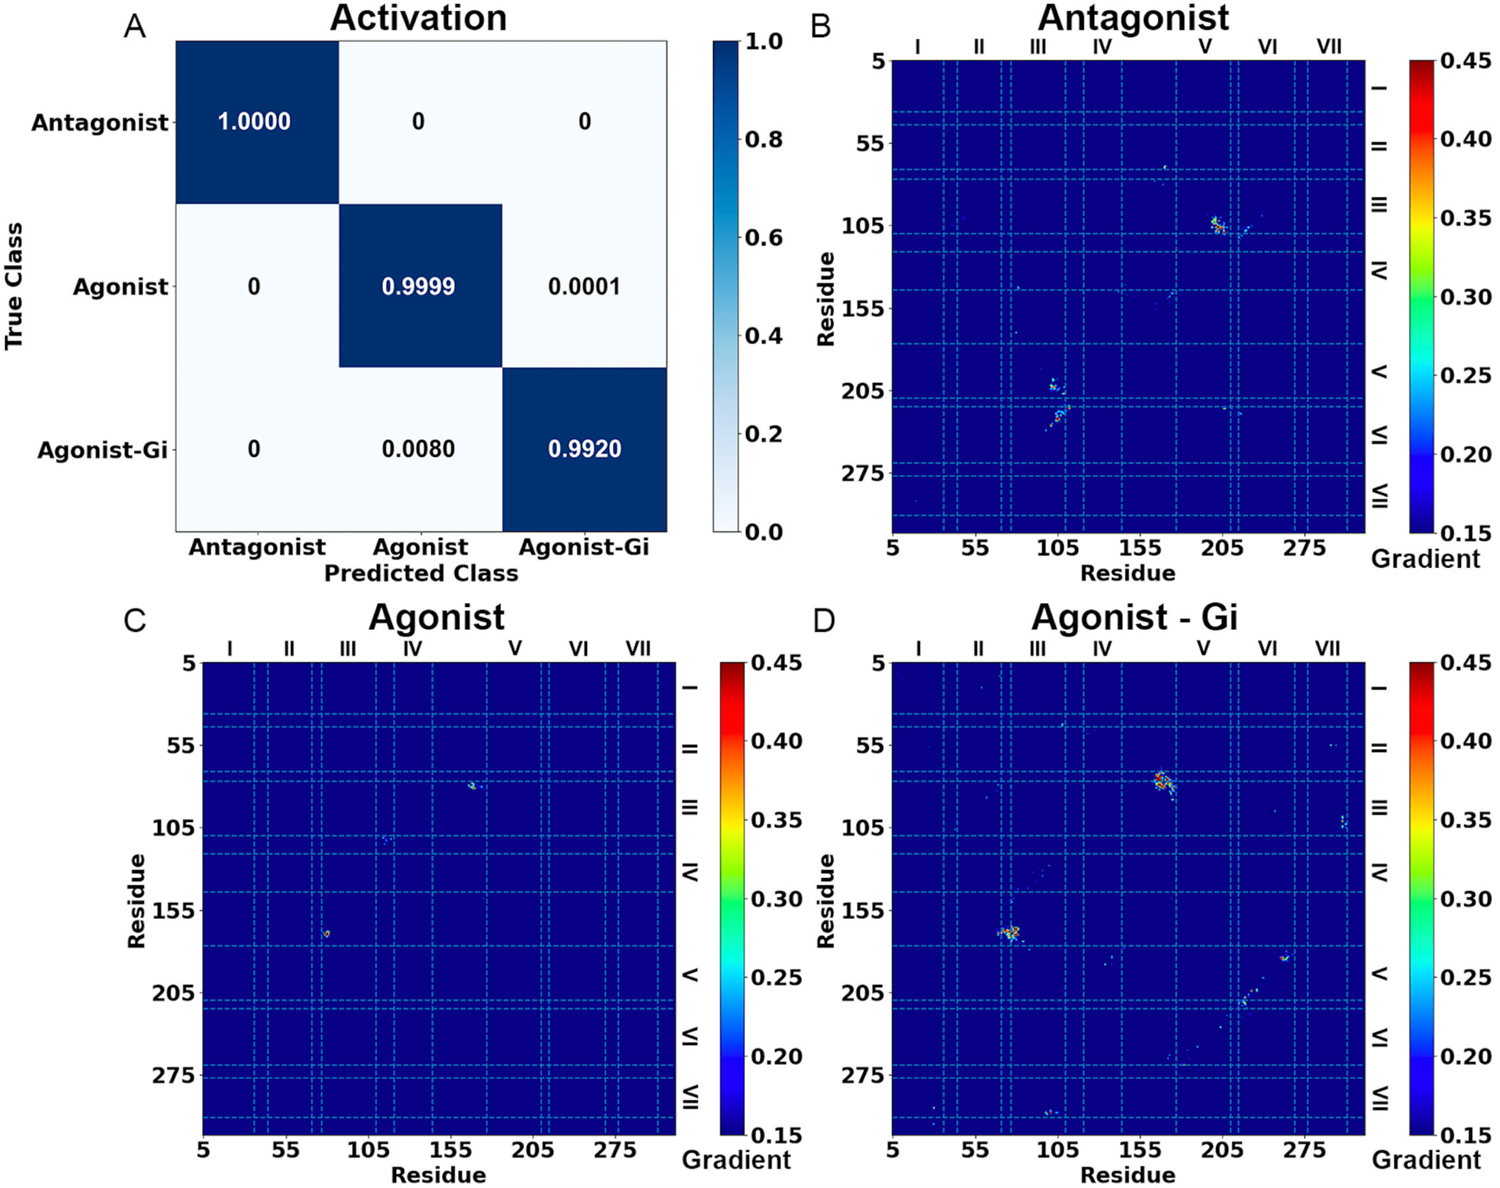
Figure 2. Demonstration of GLOW on characterization of GPCR activation using adenosine A1 receptor (A1AR) as a model system.

(A) Classification of different A1AR systems bound by the “Antagonist”, “Agonist” and “Agonist – Gi”. (B-D) Saliency (attention) maps of residue contact gradients of the A1AR bound by (B) “Antagonist”, (C) “Agonist” and (D) “Agonist – Gi”. The seven transmembrane helices are labeled from I to VII. The gradient of each residue contact is shown in a 0.15 (blue) to 0.45 (red) color scale.
