
Figure 4. Low-energy conformational states of the A1AR during activation uncovered by GLOW.
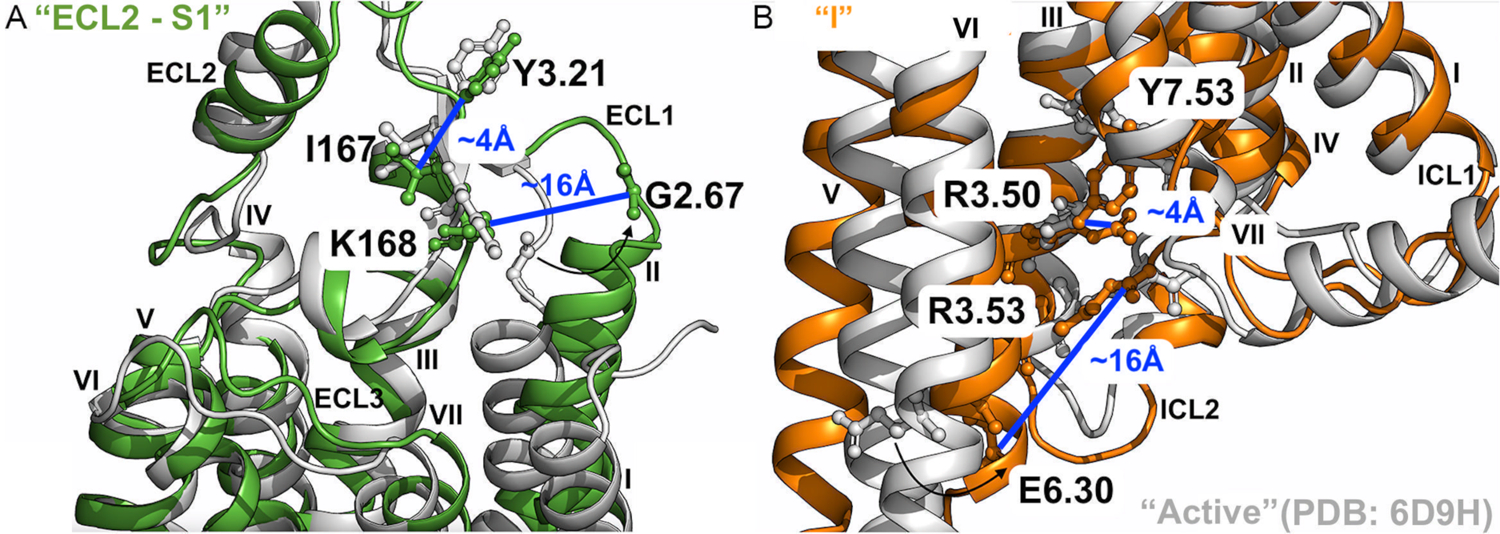
(A) Low-energy conformational state “ECL2 – S1” (Figure 3C) compared to the active 6D9H PDB structure. The distance between residues G2.67 and K168ECL2 is ~16Å, and ~4Å between residues Y3.21 and I167ECL2. (B) Low-energy conformational state “I” (Figures 3E) compared to the active 6D9H PDB structure. The distance between residues R3.53 and E6.30 is ~12Å, and ~4Å between residues R3.50 and Y7.53. The A1AR bound by “Agonist” and “Agonist – Gi” are colored orange and green, respectively, and the 6D9H PDB structure is colored gray.