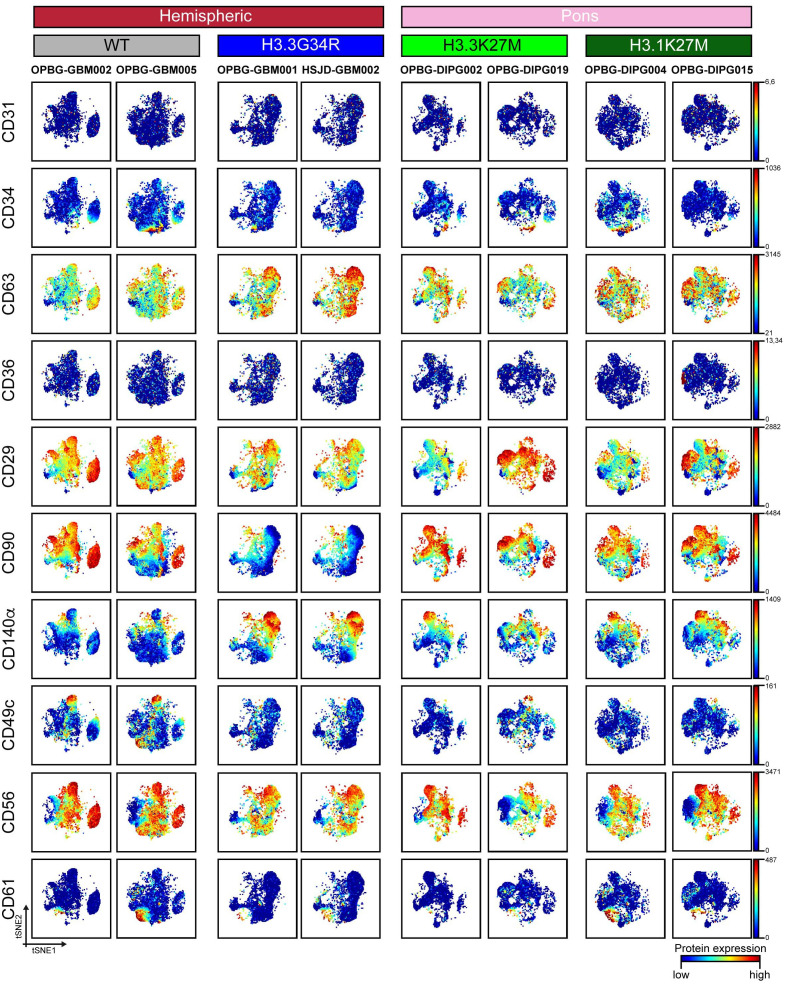
Figure 2.
CyTOF single-cell analysis of surface antigens in PDHGG patient-derived cell lines. t-SNE maps showing the expression of 10 surface markers (CD31, CD34, CD63, CD36, CD29, CD90, CD140a, CD49c, CD56 and CD61) in each of the eight different PDHGG patient-derived cell lines analyzed through mass cytometry technique. The color gradient refers to the intensity of the expression of the considered marker, in a blue to red scale indicating low and high intensity respectively.

