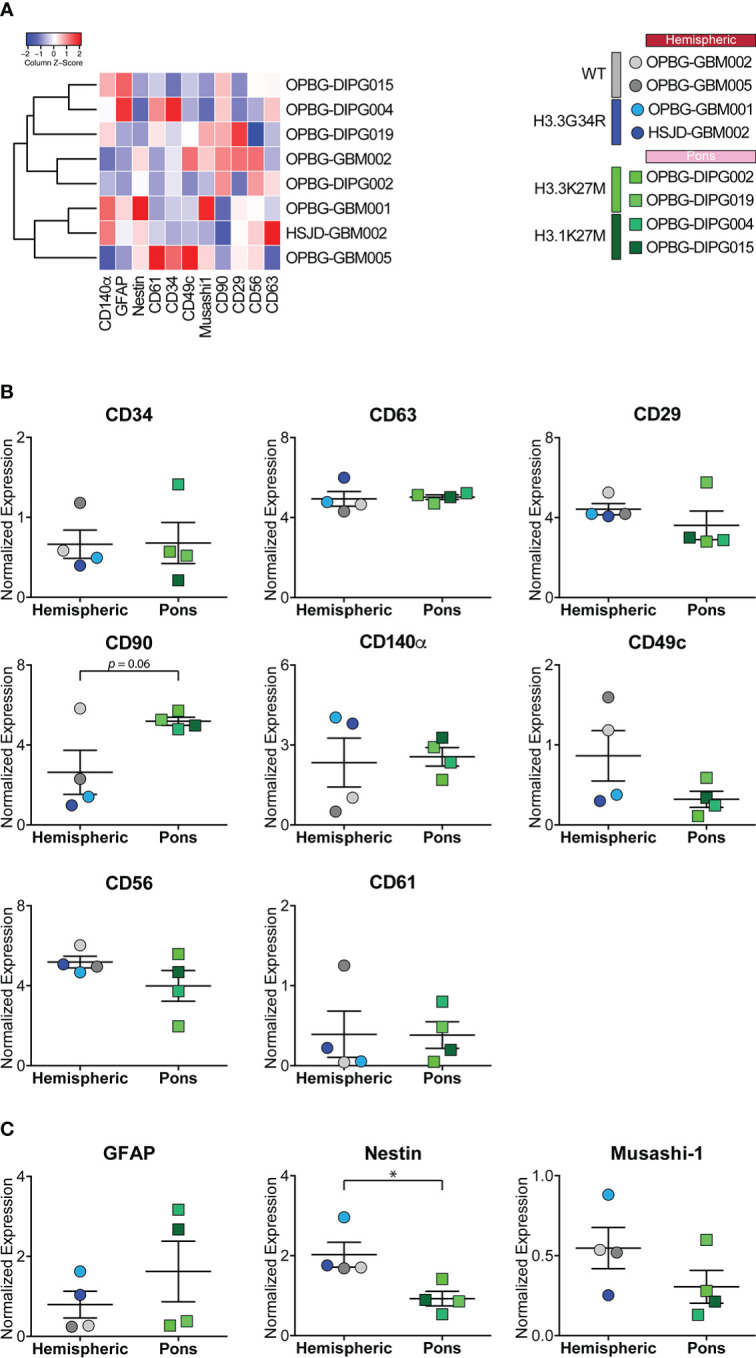
Figure 4.

Marker expression analyzed through CyTOF technique in PDHGG patient-derived cell lines. (A) Heatmap summarizing the expression of the analyzed cell markers in the eight PDHGG cell lines. (B) Scatter dot plots showing the normalized expression of the indicated surface (B) and intracellular (C) markers in hemispheric and pontine PDHGG patient-derived cell lines. Each shape of the scatter dot plot indicates a different tumor location (round for hemispheric, square for pontine) while the color coding refers to the cell line mutational subgroups (see the key legend). *p < 0.05.
