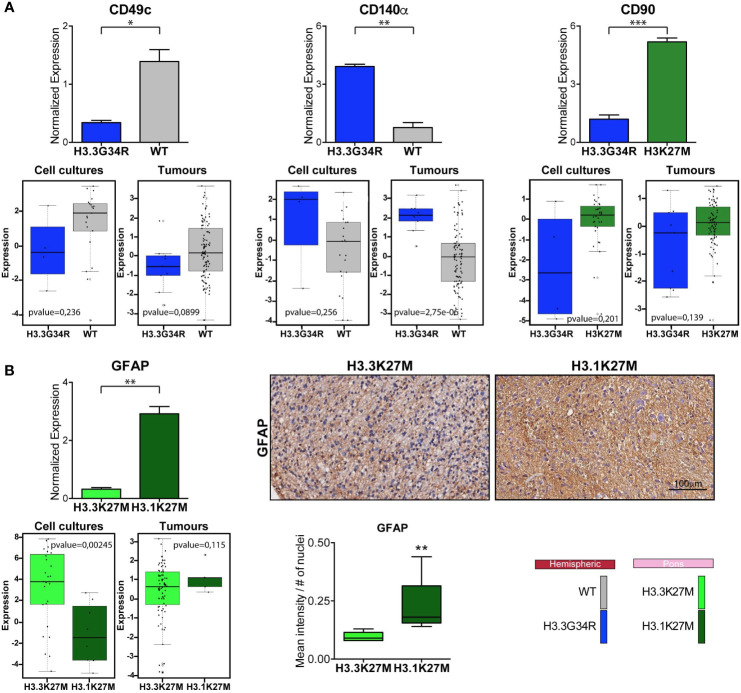
Figure 5.
Comparison of marker expression in different molecular PDHGG patient-derived cell lines. (A) Bar plots showing the comparison between the H3WT vs H3.3G34R and H3K27M vs H3.3G34R PDHGG molecular subgroups relative to the expression of the indicated marker. The data on the top refer to the marker normalized expression obtained from mass cytometry data analysis while the plots on the bottom were obtained from RNA seq analysis on both patient-derived cell cultures (n=68) and tumor tissues (n=133). Data are represented as mean ± SEM. (B) Bar plots relative to the expression of GFAP marker in the H3.3K27M vs H3.1K27M PDHGG molecular subgroups obtained from CyTOF and RNA seq analysis. Representative images of GFAP immunohistochemistry on H3.3K27M and H3.1K27M PDHGG FFPE tissue slides together with the relative quantification of GFAP signal intensity normalized on the number of nuclei (n=5 for H3.1K27M; n=6 for H3.3 K27M). *p < 0.05; **p < 0.01; ***p < 0.001.

