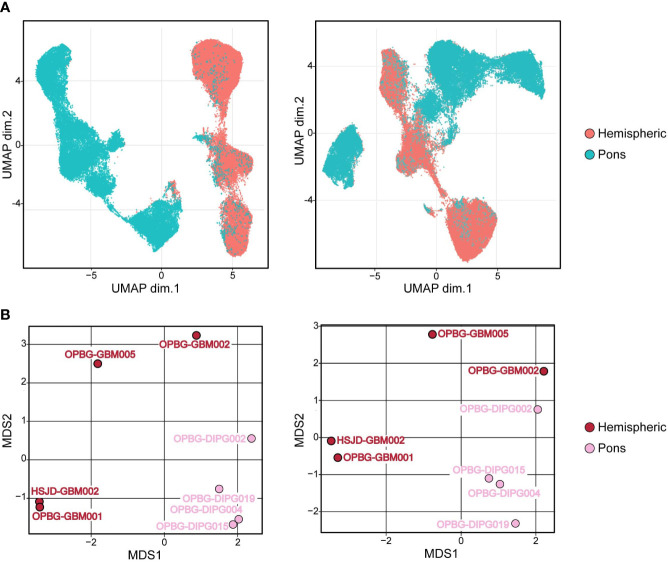
Figure 6.
Hemispheric and pons patient-derived cell line separation. (A) UMAP projections and (B) Multidimensional Scaling plot (MDS) of PDHGG patient-derived cell lines obtained by including (left) or not (right) H3.3G34R and H3K27M histone variants in the relative analysis performed on single-cell mass cytometry data. The color refers to the locational subgroup to which the PDHGG patient-derived cell lines belong (hemispheric or pons, see the relative key legend).

