Figure 3.
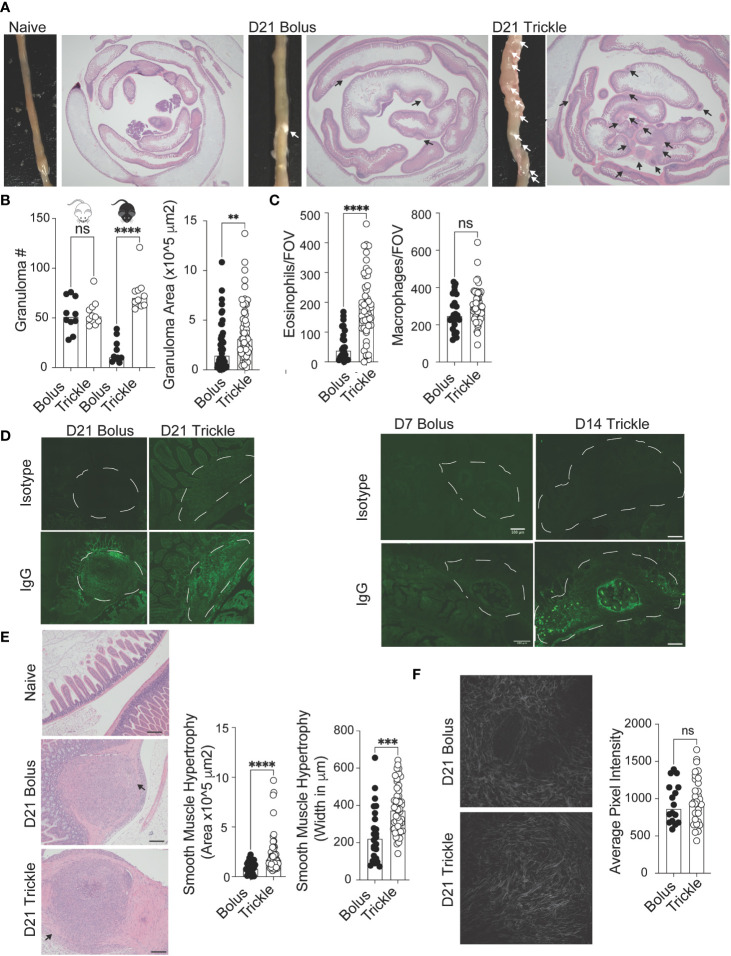
The reduced worm burden in trickle-infected C57Bl/6 mice is associated with increased granuloma size, number and level of IgG as well as intestinal muscle hypertrophy/hyperplasia. 6-8 week old C57Bl/6 and BALB/c mice were infected with 200 H polygyrus larvae according to the bolus and trickle infection regimes. (A) Representative images of granuloma pathology. Representative photographs showing the small intestine of naïve, D21 bolus and D21 trickle-infected C57Bl/6 mice. White arrows point to granulomas. Whole small intestinal swiss rolls were cut into 6 µm paraffin embedded sections and stained with H & E. Representative photographs highlight the granulomas (black arrows). (B) Granulomas were counted on the outside of the small intestine using a dissection microscope for identification (left). Granuloma area was measured on H & E sections (right). (C) Eosinophil (left) and macrophage (right) counts within the center of the granulomas. H & E slides were used to identify eosinophils and macrophages at x400 magnification. Cells were counted for one field of view (FOV) per granuloma. (D) Formalin fixed, paraffin-embedded 6 μm sections were obtained from small intestine swiss rolls. These sections were co-stained with anti-mouse IgG1 and DAPI. Whole sections were studied using the Thorlabs Tide whole-slide scanning microscope (20x objective). Representative granulomas (white dashed line) from D21 (left, no developing worms) and D7 bolus/D14 trickle (right, developing worms present) infected animals with both isotype control (top) and antibody stain (bottom). (E) Left: representative images of smooth muscle cell hypertrophy/hyperplasia on H & E-stained sections. Pink areas around granulomas represent smooth muscle. Black arrows point to areas where collagen density was measured, scale bar = 200um. Right: intestinal smooth muscle area and width were measured on H & E slides for each granuloma (F) Left: representative photographs of collagen within the granulomas using SHG imaging. Right: Collagen density per FOV measured using ImageJ. Data pooled from 2 experiments with a minimum of 2 mice per group per experiment. A normality test was performed (Anderson-Darling) followed by Kruskal Wallis tests with Dunn’s multiple comparisons test and/or an unpaired T-test/Mann-Whitney test to test for statistical significance between trickle and bolus groups, n.s., not significant, **p<0.01, ***p<0.001, ****p<0.0001.

