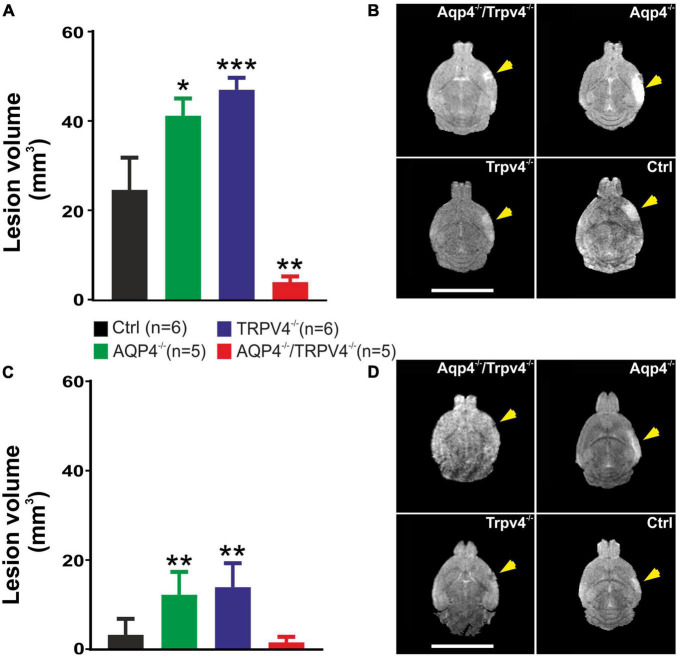
FIGURE 1.
Quantification of the ischemic lesion volume using T2-weighted magnetic resonance imaging of the mouse brain 1 day (D1) and 7 days (D7) after pMCAO. (A) Bar graph showing an average volume of the ischemic lesion in the AQP4–/–, TRPV4–/–, and AQP4–/–/TRPV4–/– mice compared to the Ctrl at D1 after pMCAO. Note that mice lacking AQP4 or TRPV4 channels showed significantly higher lesion volume, whereas the volume of the lesions in the mice lacking both channels was significantly reduced when compared to the single knockouts. (B) Representative T2-weighted images of the brains of the Ctrl, AQP4–/–, TRPV4–/–, and AQP4–/–/TRPV4–/– mice at D1 after pMCAO. The lesion is visible as a mild hyperintense area in the left hemisphere (yellow arrowheads). (C) Bar graph showing an average volume of the ischemic lesion in the AQP4–/–, TRPV4–/–, and AQP4–/–/TRPV4–/– mice compared to the Ctrl at D7 after pMCAO. Note that at D7 after pMCAO the lesion volume remains larger in the AQP4–/– as well as TRPV4–/– mice compared to the Ctrl, but in the AQP4–/–/TRPV4–/–, the lesion size is comparable to Ctrl. (D) Representative T2-weighted images of the brains of the Ctrl, AQP4–/–, TRPV4–/–, and AQP4–/–/TRPV4–/– mice at D7 after pMCAO. The lesion is visible as a mild hyperintense area in the left hemisphere (yellow arrowheads). Data are presented as mean + SEM. Asterisks indicate significant differences between the AQP4–/–/TRPV4–/– mice and the Ctrl (*p < 0.05, **p < 0.01, ***p < 0.001). Ctrl, control; AQP4–/–, AQP4-deficient mice; TRPV4–/–, TRPV4-deficient mice; AQP4–/–/TRPV4–/–, AQP4- and TRPV4-deficient mice; pMCAO, permanent middle cerebral artery occlusion.

