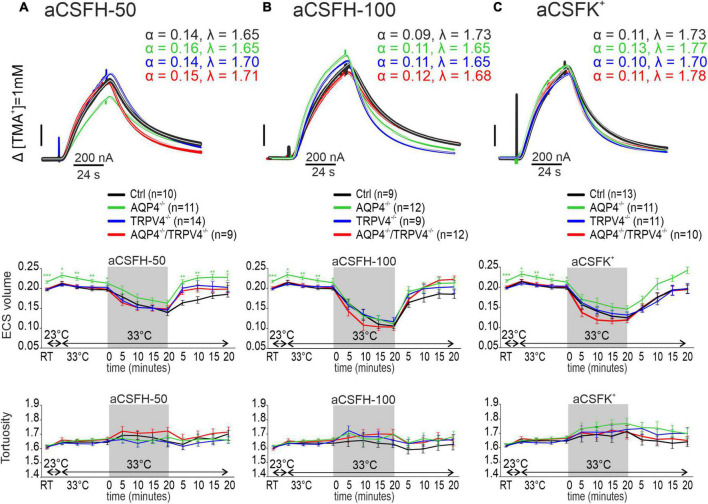
FIGURE 4.
The effect of hypoosmotic stress (A,B) and hyperkalemia (C) on the ECS diffusion parameters in situ. Representative diffusion curves with the corresponding values of the ECS volume fraction (α) and tortuosity (λ) recorded in the Ctrl, AQP4–/–, TRPV4–/–, and AQP4–/–/TRPV4–/– mice (upper panels). Averaged data of α (middle panels) and λ (bottom panels) measured in the Ctrl, AQP4–/–, TRPV4–/–, and AQP4–/–/TRPV4–/– mice at resting conditions (22–24°C), 33°C and at 5-min intervals during and after (washout) applications of aCSFH–50, aCSFH–100, and aCSFK+ solutions. Data are expressed as mean ± SEM. No significant differences were detected between the AQP4–/–/TRPV4–/– and control animals. Ctrl, control; AQP4–/–, AQP4-deficient mice; TRPV4–/–, TRPV4-deficient mice; AQP4–/–/TRPV4–/–, AQP4- and TRPV4-deficient mice; aCSFH–50, 250 mOsmol hypotonic solution; aCSFH–100, 200 mOsmol hypotonic solution; aCSFK+, 50 mM K+ solution.

