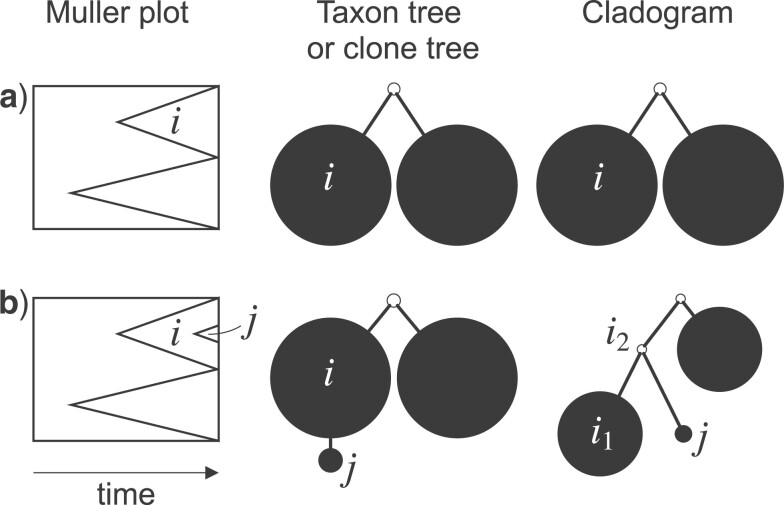
Figure 2.
Muller plots (left column), taxon or clone trees (middle column), and cladograms (right column) representing evolution by splitting only (a) and both splitting and budding (b). In a Muller plot, polygons represent proportional subpopulation sizes (vertical axis) over time (horizontal axis), and each descendant is shown emerging from its parent polygon. In the trees, nodes represented by empty circles correspond to extinct types.

