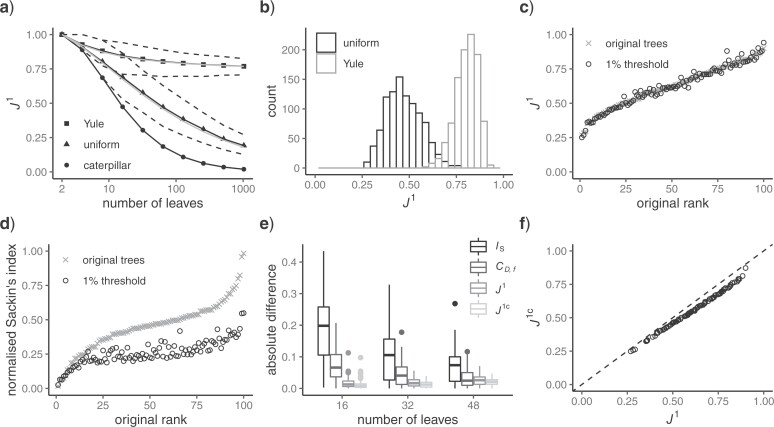
Figure 5.
a)  values for caterpillar trees and random trees generated from the Yule and uniform models (1000 trees per data point). All internal nodes have null size and all leaves have equal size. Solid black curves are the means; dashed curves are the 5th and 95th percentiles; and gray curves are
  divided by the corresponding expectation of
  (where
  is the number of leaves). b)
  distributions for random trees on 64 leaves generated from the Yule and uniform models (1000 trees per model). c)
  values for 100 random trees on 16 leaves, before and after applying a 1
 sensitivity threshold. These random trees were generated from the alpha-gamma model with
  and
and  . d)
. d)  values for the same set of random trees. e) Absolute change in normalized index values due to applying a 1
 sensitivity threshold. Results are based on 100 random trees for each number of leaves, generated as in (c) and (d).
  here is the Colless-like index with
  and
and  is the mean deviation from the median, as recommended by Mir et al. (2018). f) Values of
  versus
  for random multifurcating trees on 16 leaves, with node sizes drawn from a continuous uniform distribution. The dashed reference line has slope 1.

