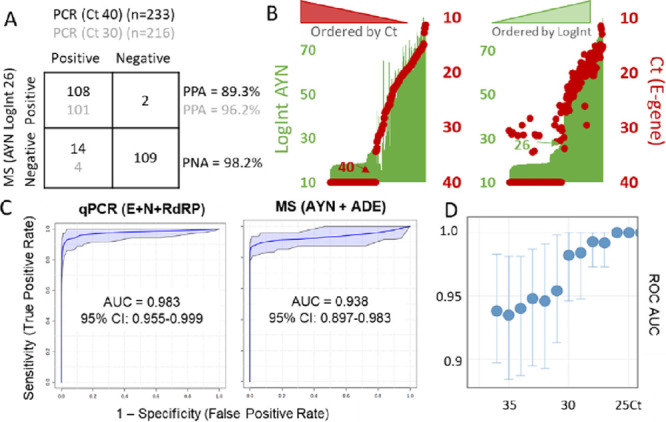
Figure 2.

Comparison between RT-qPCR and SISCAPA-LC–MS performed on 233 patient samples in three different transport media. (A) A patient sample batch in different media displays a high percent positive (PPA = TP/(TP + FN)) and negative agreement (PNA = TN/(TN + FP)) between RT-qPCR (Ct) and MS (LogInt), especially below Ct 30 (gray numbers). (B) Secondary axis plots of the raw measurements of E-gene Ct (red dots) and AYN logarithmically transformed MS intensities (LogInt) (green bars) for patients sorted from high to low Ct (left) and low to high LogInt (right). A strong linear correlation illustrates the level of agreement between both tests. The patient samples were only prepared once since we only had access to the residual volume (<300 μL) after clinical RT-qPCR analysis. (C) ROC with true positives defined by either RT-qPCR (left) or MS (right). AUC: area under the curve. (D) ROC AUCs for each Ct value separately. Up to Ct 26, there is perfect agreement (AUC = 1). Above Ct 30, a noticeable drop-off to an AUC of 0.95 can be seen, suggesting that from here on, both diagnostic tests start to disagree. Error bars indicate the 95% confidence interval (CI).
