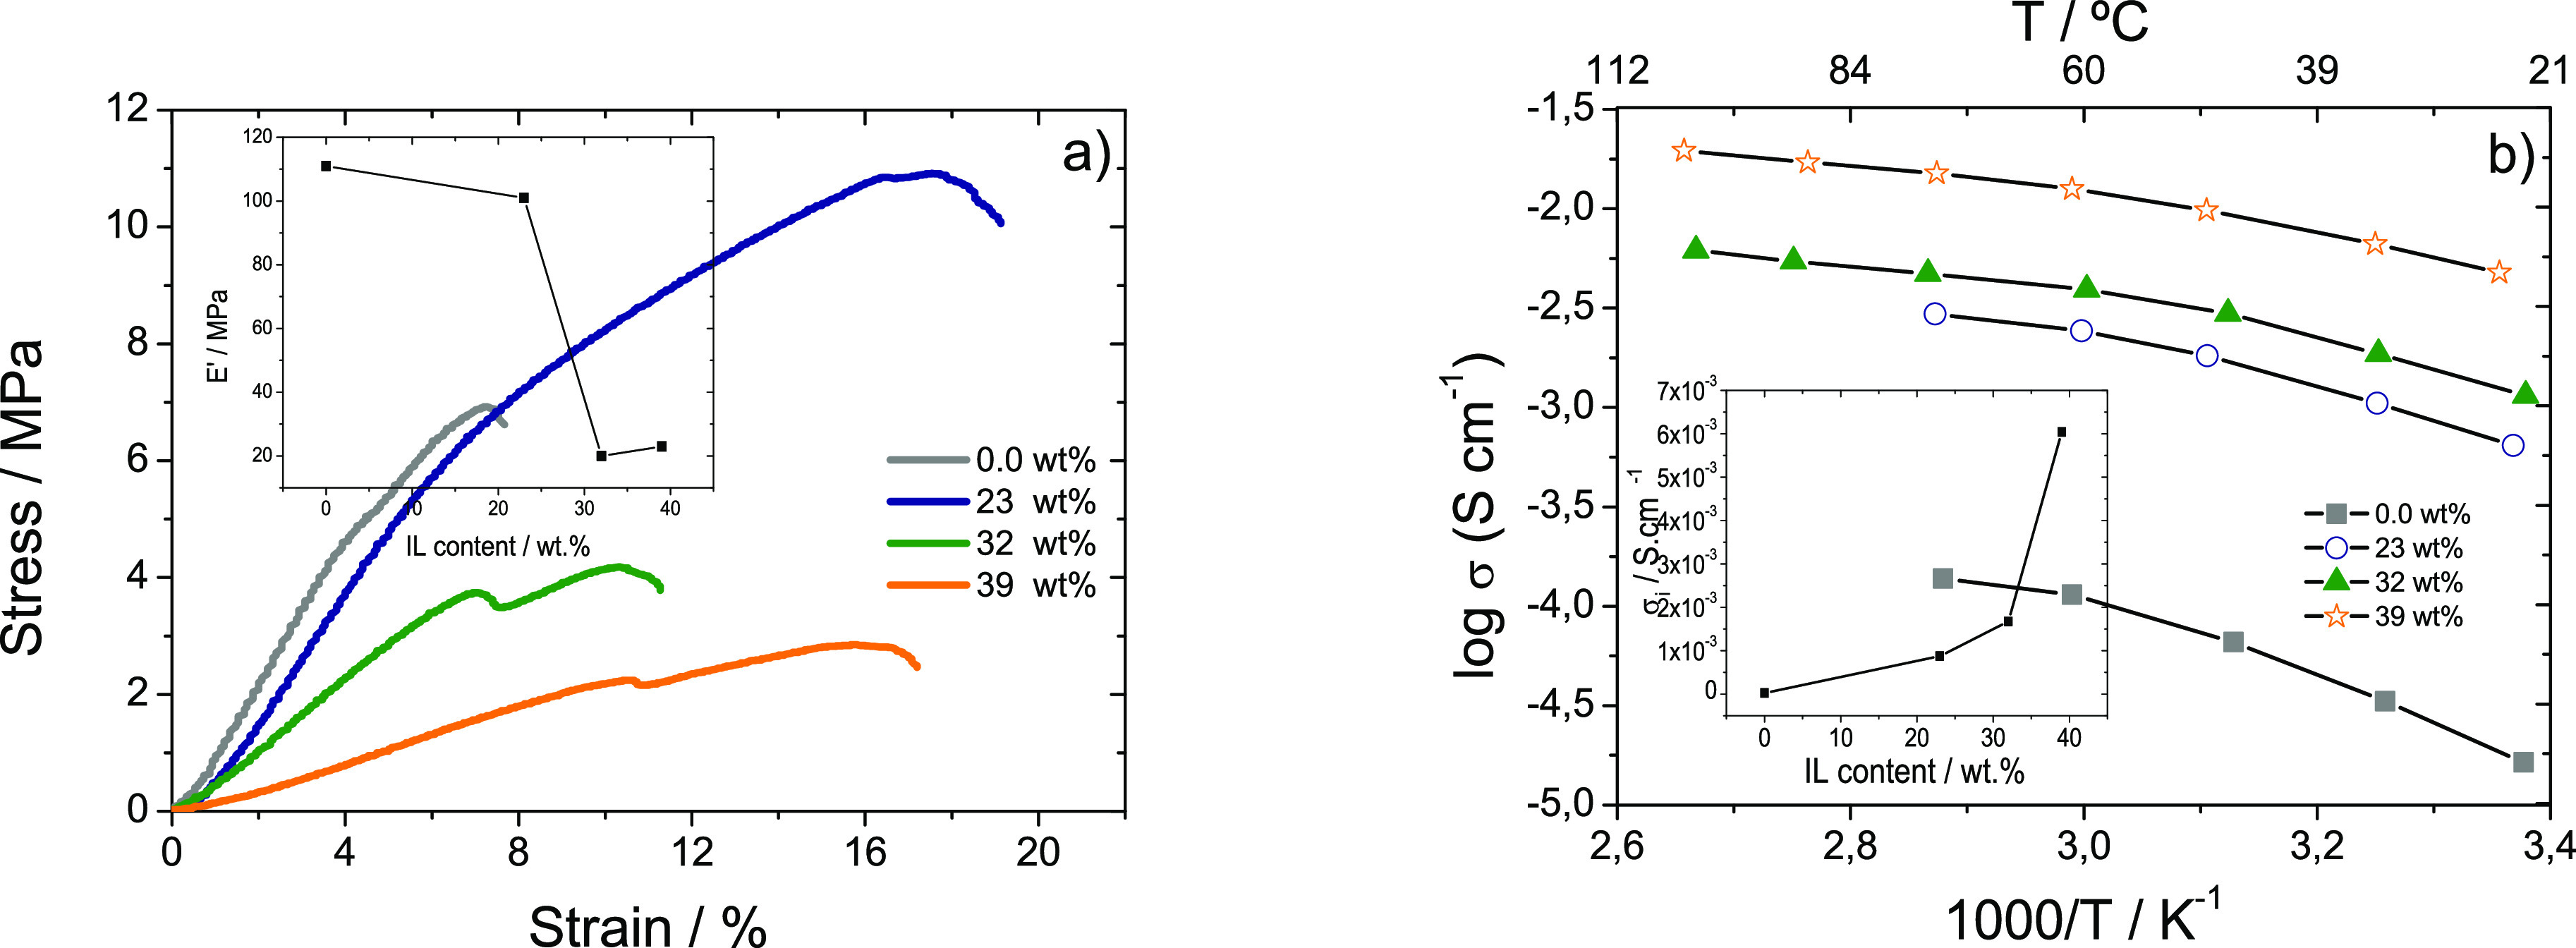
Figure 5.

(a) Stress–strain curves. The inset shows the Young modulus as a function of IL content in the polymer matrix. (b) ionic conductivities as a function of temperature for the gellan gum matrix and gellan gum electrolytes containing [Emim][SCN]. The inset shows the ionic conductivity of the samples as a function of IL content.
