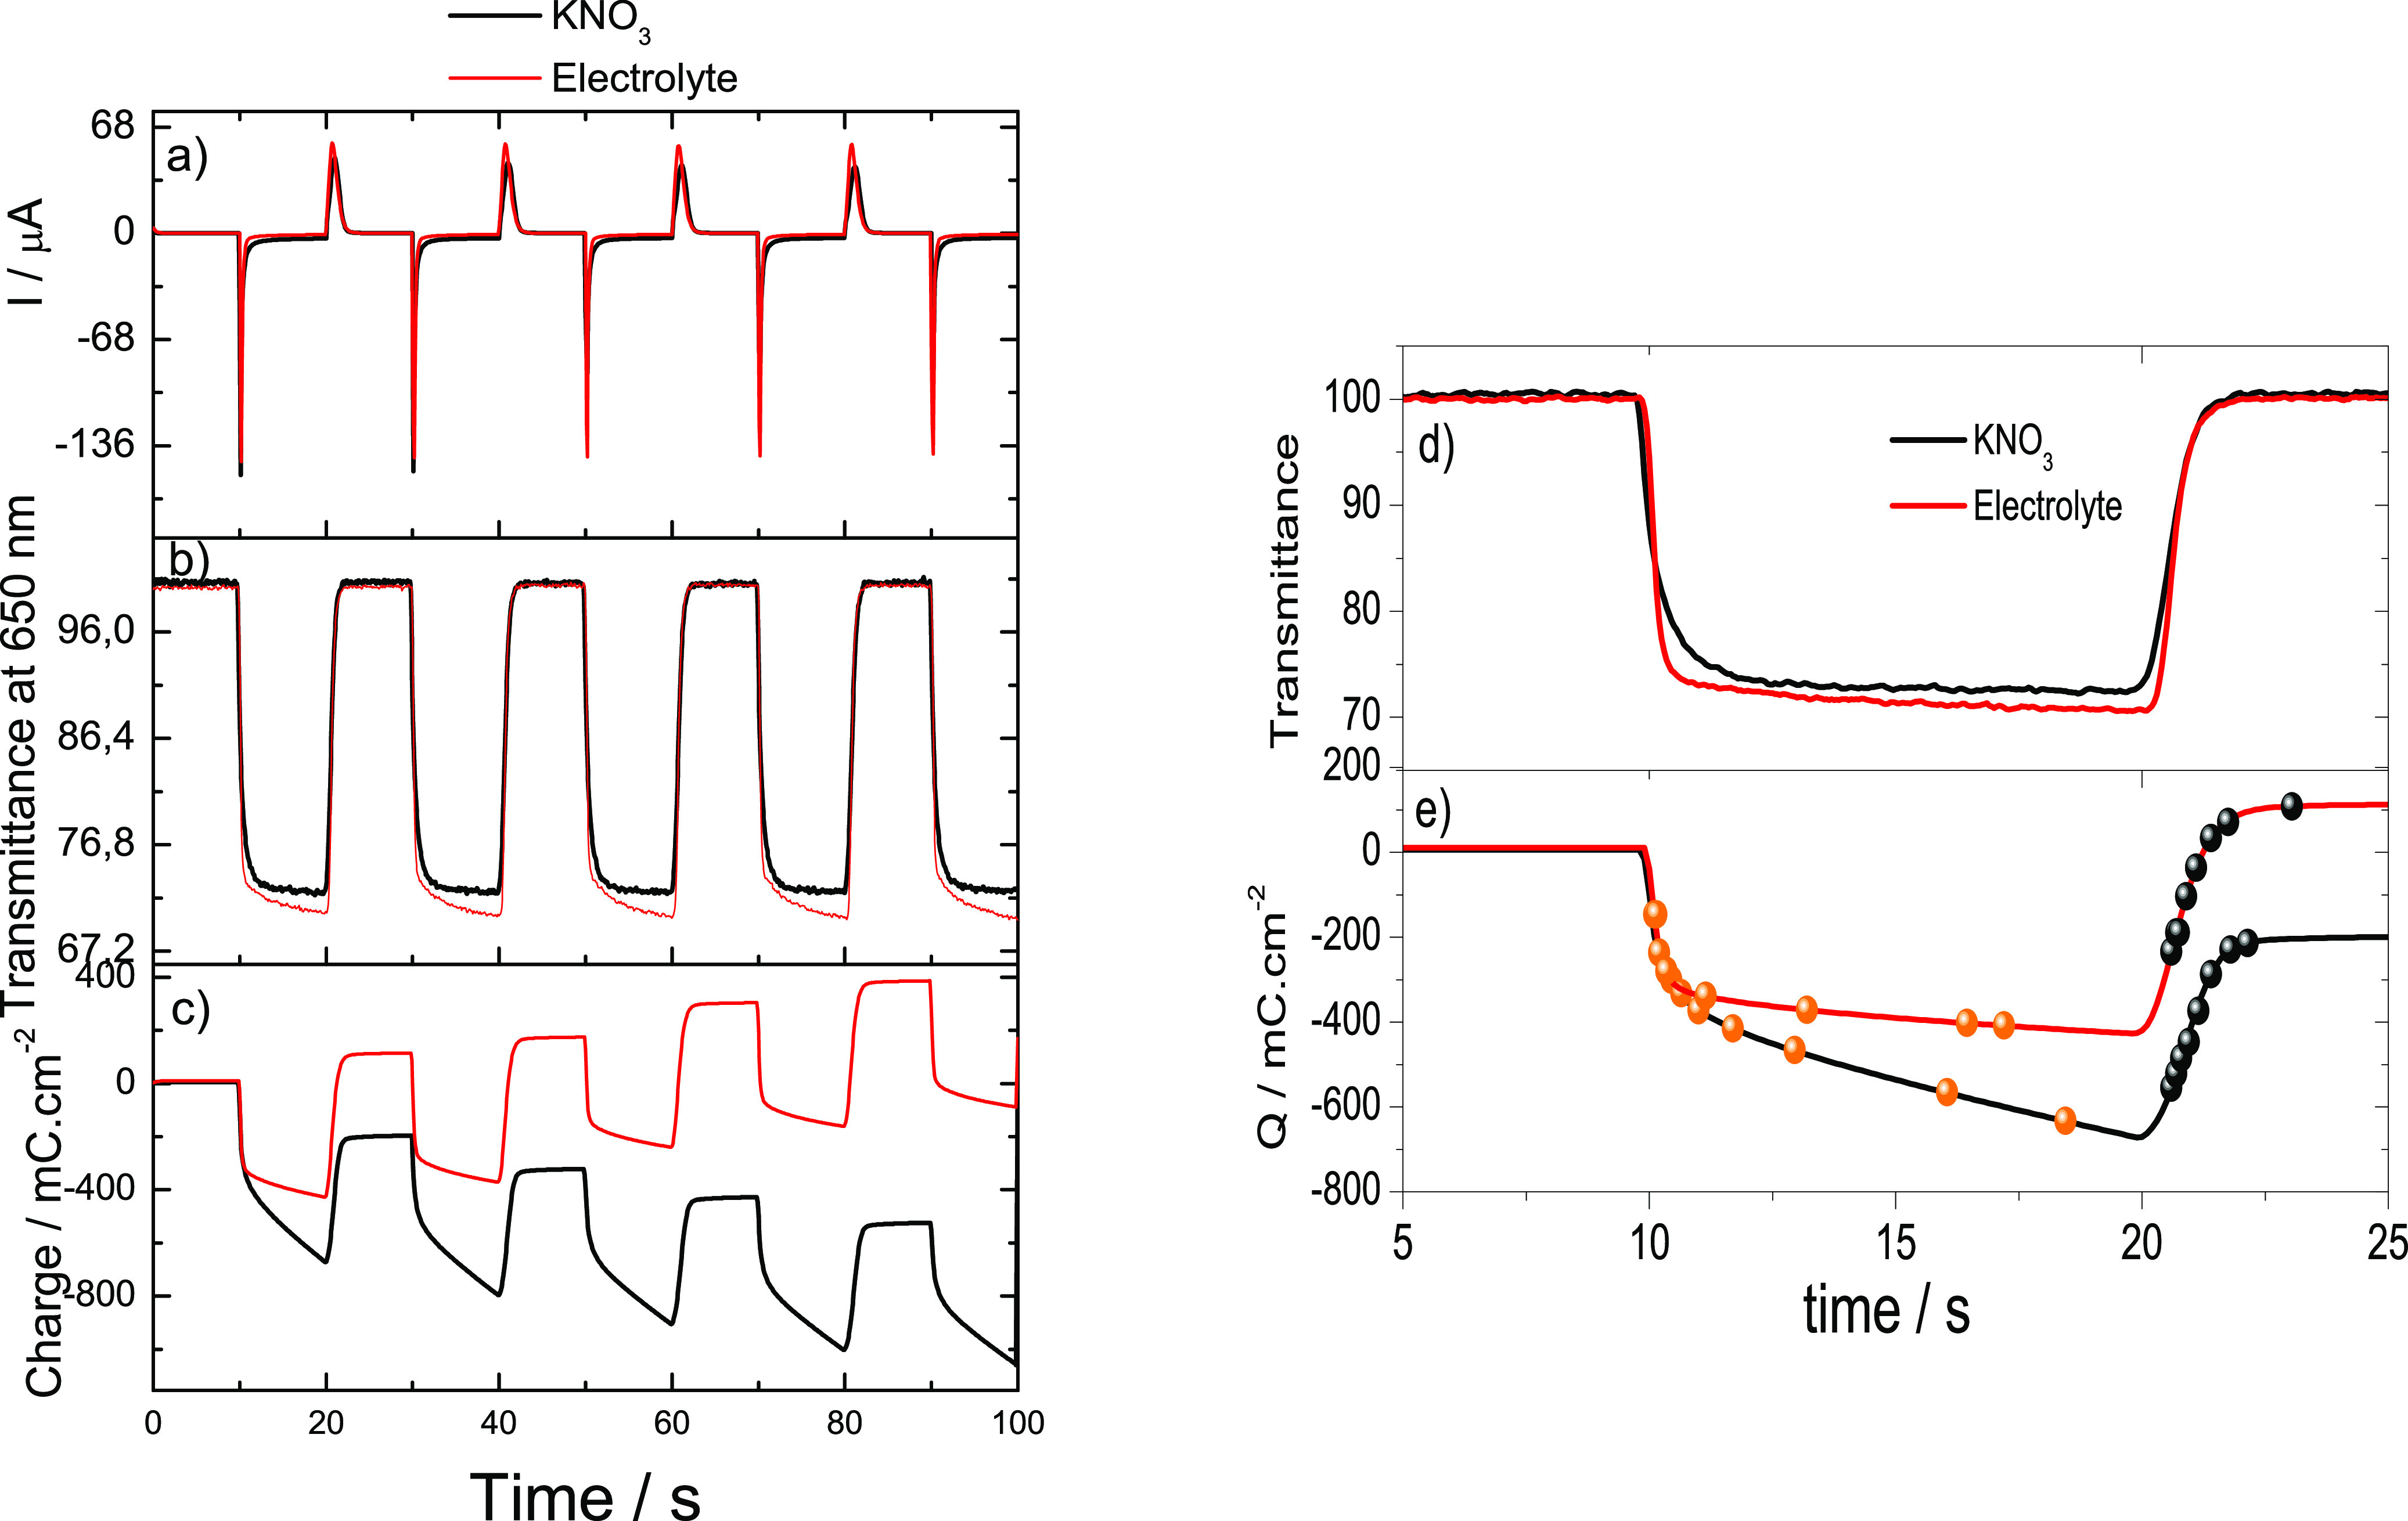
Figure 8.

Ten s potential steps between 0.0 and −1.2 V vs Ag at a PEDOT electrode in 0.1 M KNO3 and 120 μm-thick electrolyte film: (a) current response, (b) optical electrode transmission at 650 nm, (c) total charge passed, (d) typical transmission change during two consecutive steps, and (e) total charge passed during the step depicted in (d). The dots highlight the time when the electrode was at 50, 60, 70, 80, 90, 95, 98, and 99% of its full contrast.
