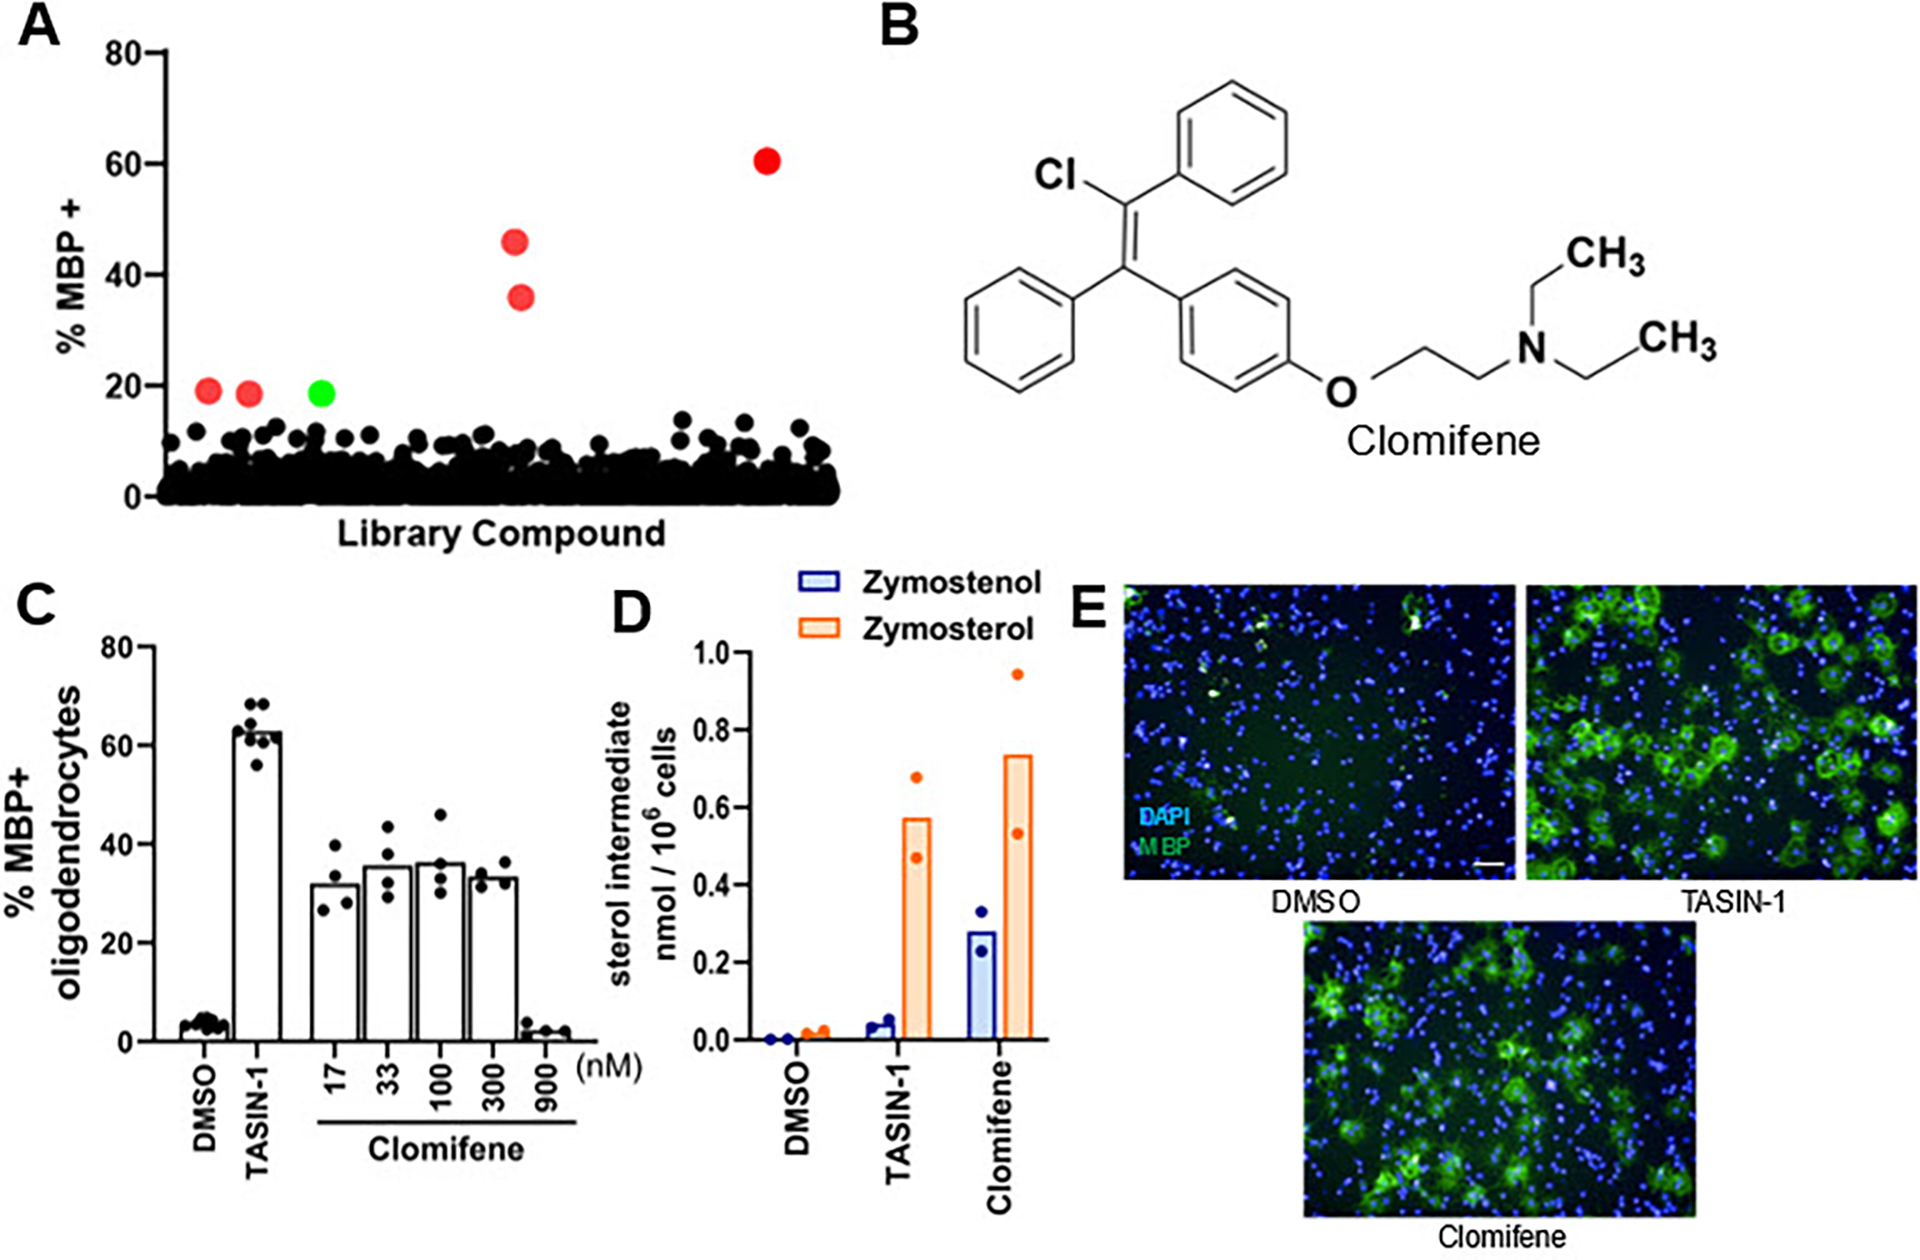
Figure 1. High-throughput screen reveals novel and known EBP inhibitors and thyroid hormone analogs as potent enhancers of oligodendrocyte formation.

(A) Percentage of MBP+ oligodendrocytes generated from OPCs following treatment with a collection of over 1,800 bioactive small molecules at a uniform screening dose of 100 nM for 72 h. Red dots represent previously characterized enhancers of oligodendrocyte formation. The green dot represents clomifene. (B) Chemical structure of clomifene. (C) Percentage of MBP+ oligodendrocytes generated from OPCs following treatment with doses of clomifene for 72 h. n ≥ 4 wells per condition. (D) GC-MS based quantification of zymostenol and zymosterol levels in OPCs treated with clomifene at 300 nM for 24 h. n = 2 wells per condition. For (C), (D), DMSO and 1 μM TASIN-1, a known EBP inhibitor, served as the negative and positive control, respectively. (E) Representative images of OPCs treated with DMSO, clomifene at 300 nM, and TASIN-1 at 1 μM. Nuclei are labeled with DAPI (blue), and oligodendrocytes are shown by immunostaining for MBP (green). Scale bar, 100 μm. (C) and (D) represent two independent experiments.
