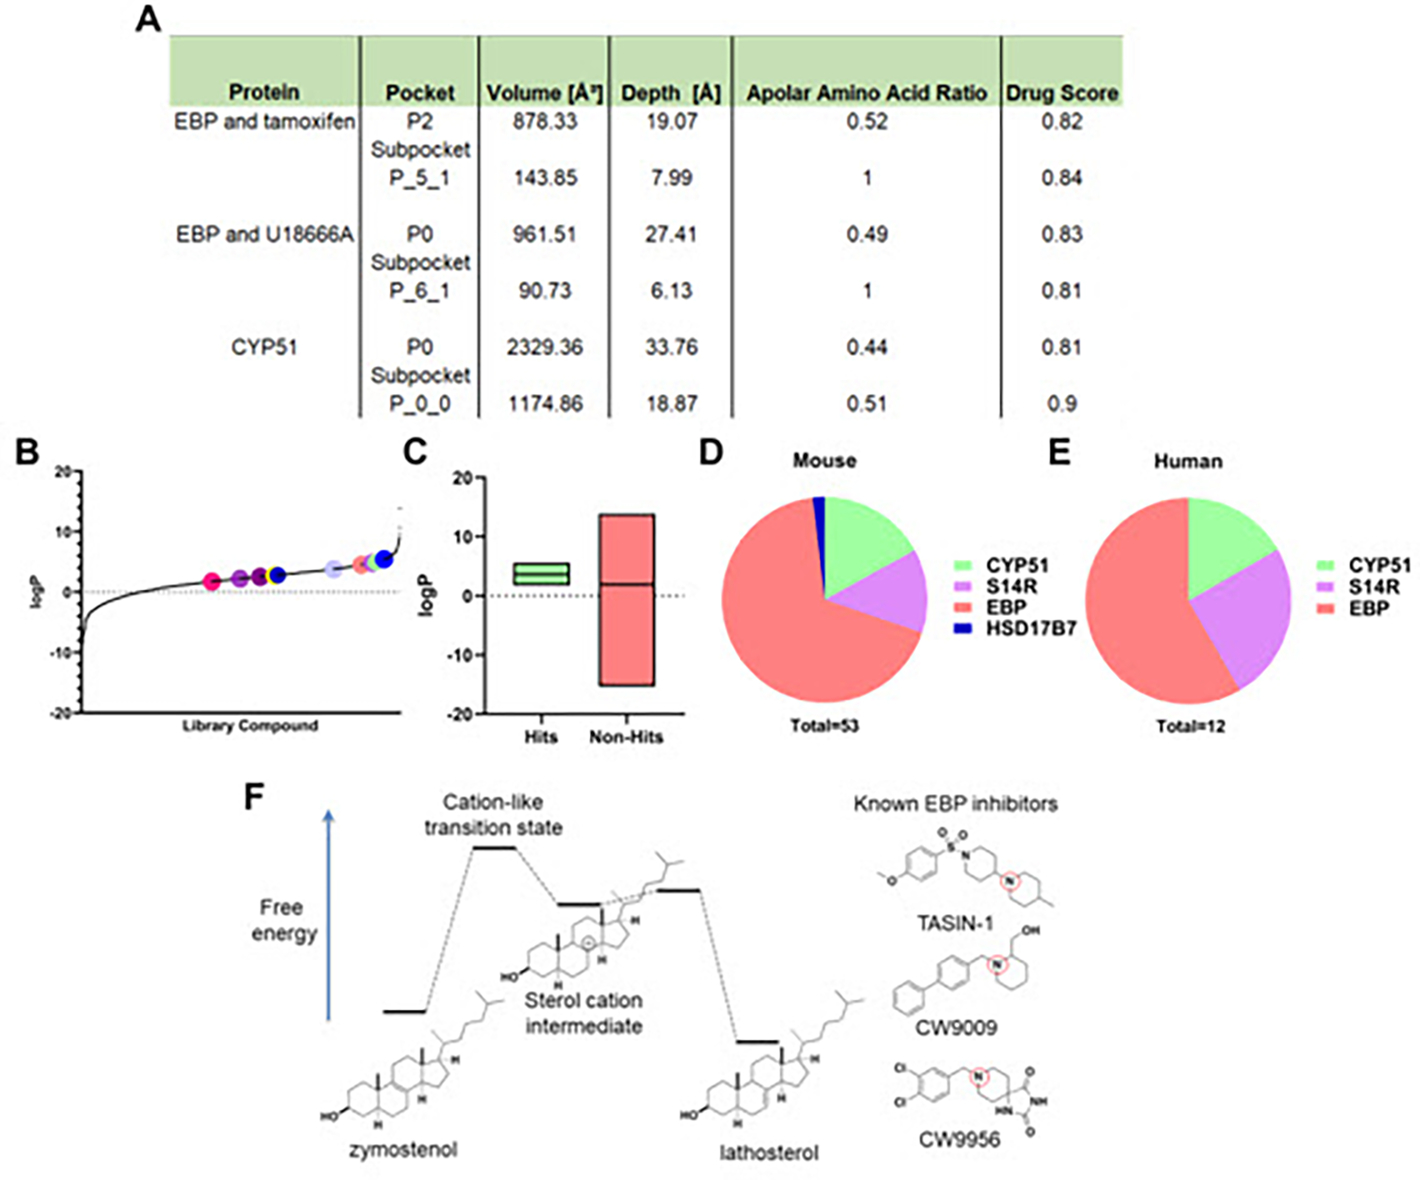
Figure 8. High logP hit molecules likely mimic sterol cation intermediate of highly druggable enzymes.

(A) Drug Score analysis performed in DoGSiteScorer using crystal structures of EBP and tamoxifen, EBP and U18666A, and CYP51. (B) logP values for all library molecules tested. Dots represent the screening hits found in fig. 2 (A), (B). (C) Box plot comparing logP values for hit molecules and molecules that did not increase oligodendrocyte maturation. Included in the left box are our previously reported screening hits in addition to those found in fig. 2 (A), (B). (D) Total number of hit molecules that have been classified as either a CYP51, sterol 14-reductase, EBP, or HSD17B7 inhibitor in mouse OPCs. (E) Total number of molecules characterized as either a CYP51, sterol 14-reductase, or EBP inhibitor in human GBM528 cells. (F) Energy diagram comparing the structure of the sterol cation intermediate within EBP’s enzymatic process to known EBP inhibitors. Red circles indicate tertiary amines likely to be cationic at physiological pH. S14R, sterol 14-reductase.
