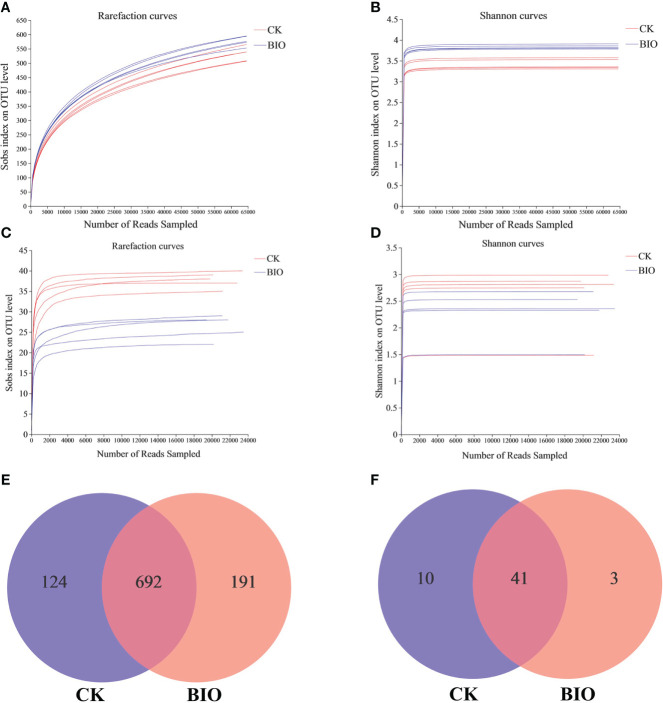
Figure 3.
Different treatment samples generate microbial rarefaction curves, Shannon curves, and venn diagrams based on OTU level. (A) Fungi rarefaction curves; (B) fungi Shannon curves. (C) AMF rarefaction curves; (D) AMF Shannon curves. (E) The unique and shared fungal OTUs in CK and BIO groups; (F) the unique and shared AMF OTUs in CK and BIO groups. CK and BIO represent the control and combined biocontrol agents inoculated plants, respectively.

