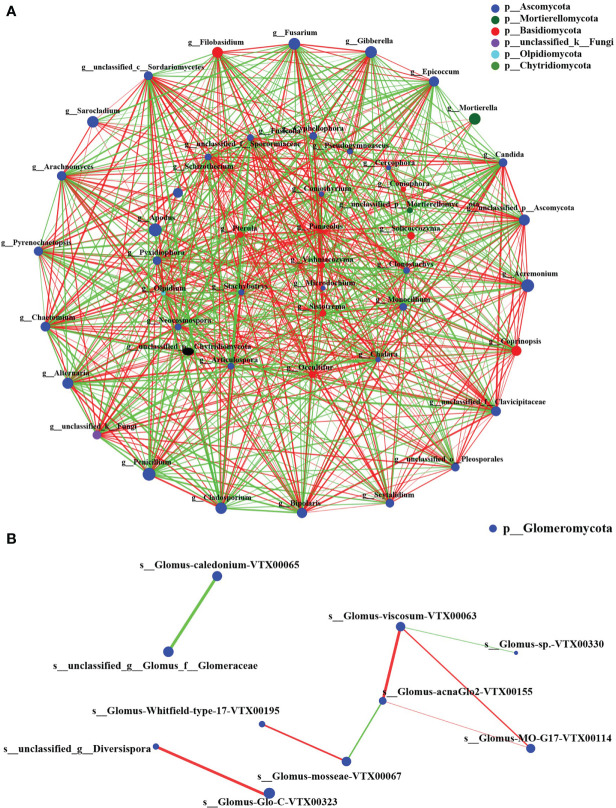
Figure 7.
The co-occurrence network on virtual taxon level of fungi and AMF. (A) The genus-level fungal correlation. (B) The species level AMF correlation. The size of nodes in the figure represents the abundance of species, and different colors represent different species. The color of connection represents positive and negative correlation; red represents positive correlation; green represents negative correlation; the thickness of line indicates the size of correlation coefficient. The thicker the line, the higher the correlation between species. The more lines, the closer the relationship between the species and other species. Species with P< 0.05 are shown by default in the figure.

