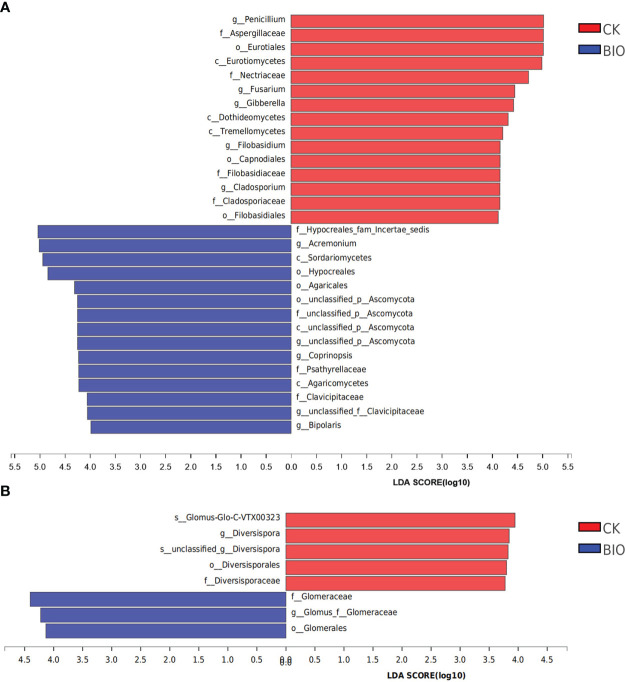
Figure 8.
Discriminant analysis of multi-level species differences in CK and BIO groups. Indicator fungi and AMF with LDA scores of 3 or greater in communities associated with soil from CK and BIO groups. (A) fungal communities. (B) AMF communities. CK and BIO represent the control and combined biocontrol agents inoculated plants, respectively. Different-colored regions represent different constituents (red, CK; blue, BIO). The greater the LDA score, the greater the effect of species abundance on the difference. Class (c), Order (o), Family (f), Genus (g), Species (s).

