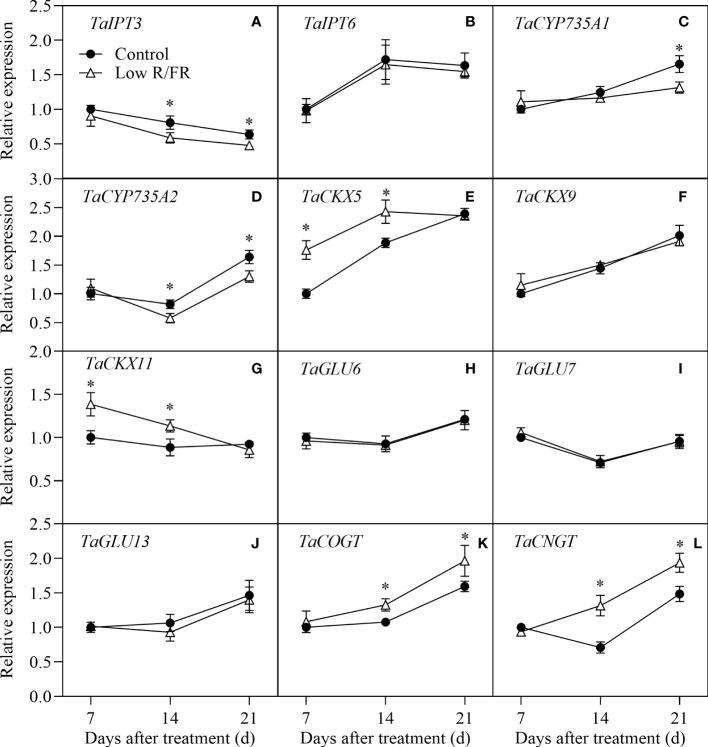
Figure 6.
Expression of CTK metabolism genes in tiller nodes under control and low R/FR conditions. Relative transcript levels of TaIPT3 (A), TaIPT6 (B), TaCYP735A1 (C), TaCYP735A2 (D), TaCKX5 (E), TaCKX9 (F), TaCKX11 (G), TaGLU6 (H), TaGLU7 (I), TaGLU13 (J), TaCOGT (K) and TaCNGT (L) in tiller nodes treated for 7, 14 and 21 D. Data are the means of three biological replicates ± SE, and the asterisk denotes a statistically remarkable difference (P < 0.05) between treated and control samples.

