
FIGURE 4.
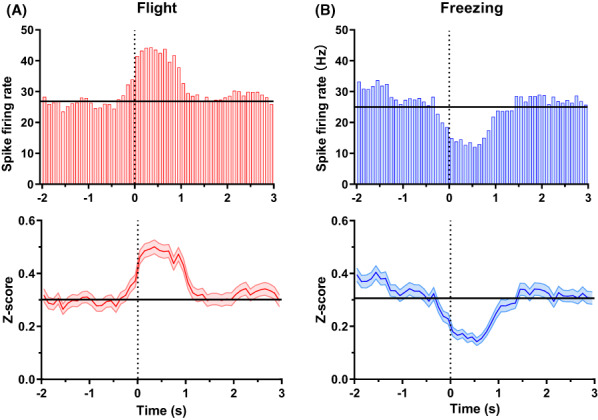
Units' activity in dPAG (dorsal periaqueductal gray) under two defensive behaviors. (A) (top) PSTHs (peri‐stimulus time histograms) of flight‐related units under flight behavior and (bottom) the normalized average firing rate of flight‐related units under flight behavior. (B) (top) PSTHs of freezing‐related units under freezing behavior and (bottom) the normalized average firing rate of freezing‐related units under freezing behavior. The vertical line represents the start of defensive behavior, and the horizontal line represents the baseline.