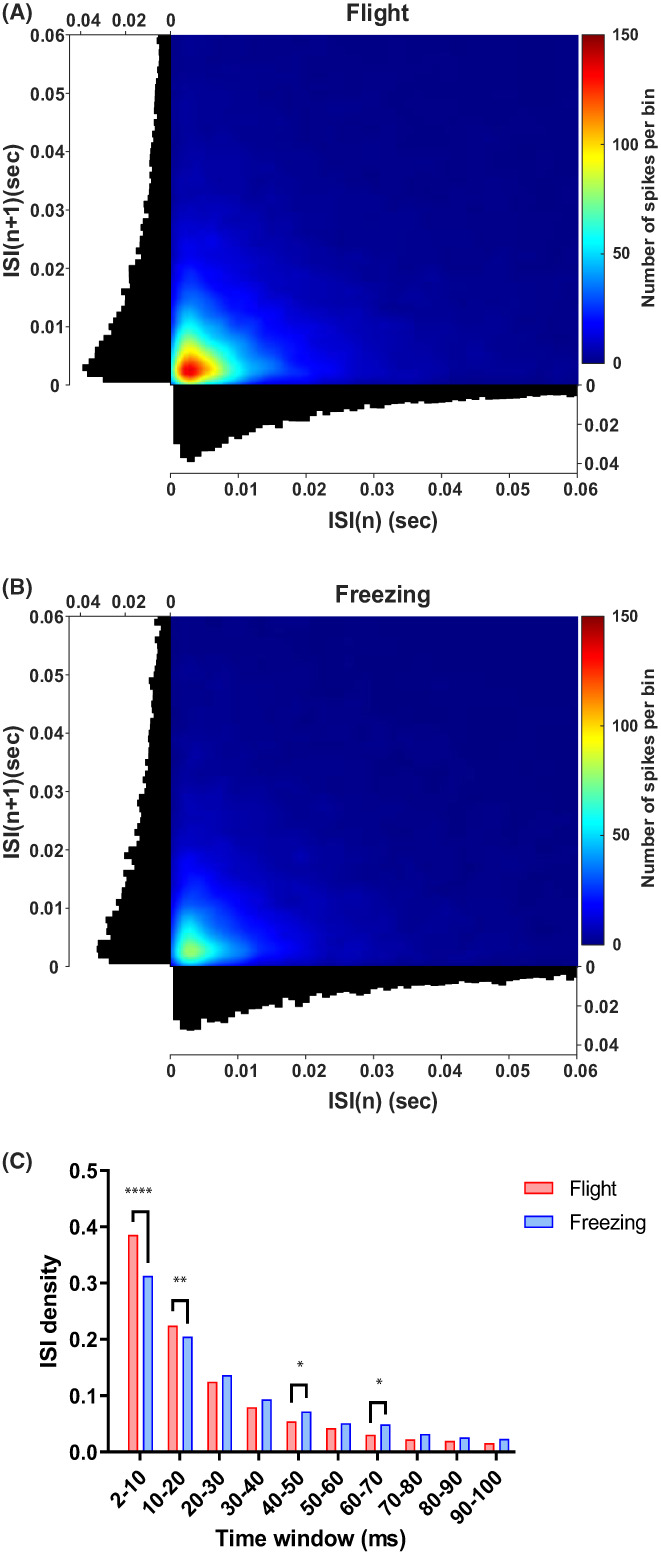
FIGURE 5.

Comparison of spike firing intervals under two defensive behaviors. (A) ISI (inter‐spike interval) density distribution under flight behavior. (B) ISI density distribution under freezing behavior. (C) ISI density distribution comparison between two defensive behaviors. Two‐way ANOVA (analysis of variance) and multiple comparisons were used to test for differences; *p < 0.05, **p < 0.01, and ****p < 0.0001.
