
FIGURE 6.
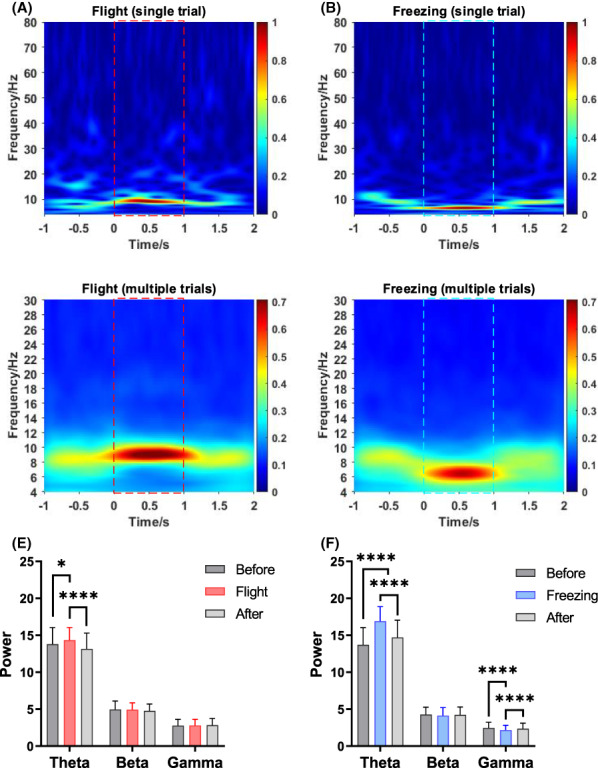
Band activity under two innate defensive behaviors. (A) Band activity under flight behavior (single trial). (B) Band activity under freezing behavior (single trial). (C) Band activity under flight behavior (averaged over multiple trials). (D) Band activity under freezing behavior (averaged over multiple trials). (E) Power variation in different frequency bands under flight behavior. (F) Power variation in different frequency bands under freezing behavior. The red dashed line box is the flight period, and the blue dashed line box is the freezing period. Two‐way ANOVA (analysis of variance) and multiple comparisons were used to compare differences; *p < 0.05, and ****p < 0.0001.