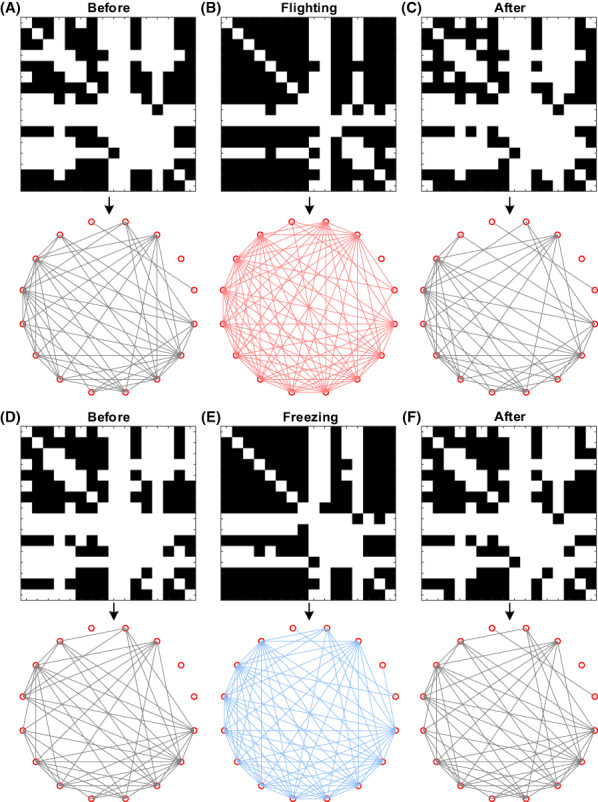
FIGURE 7.

Functional network changes in dPAG (dorsal periaqueductal gray) nuclei under flight and freezing behaviors. (A) Network connection before the flight. (B) Network connection during the flight. (C) Network connection after the flight. (D) Network connection before freezing. (E) Network connection during freezing. (F) Network connection after freezing. In each group of figures, the upper figure represents the binarized adjacency matrix, and the lower figure represents the network connection.
