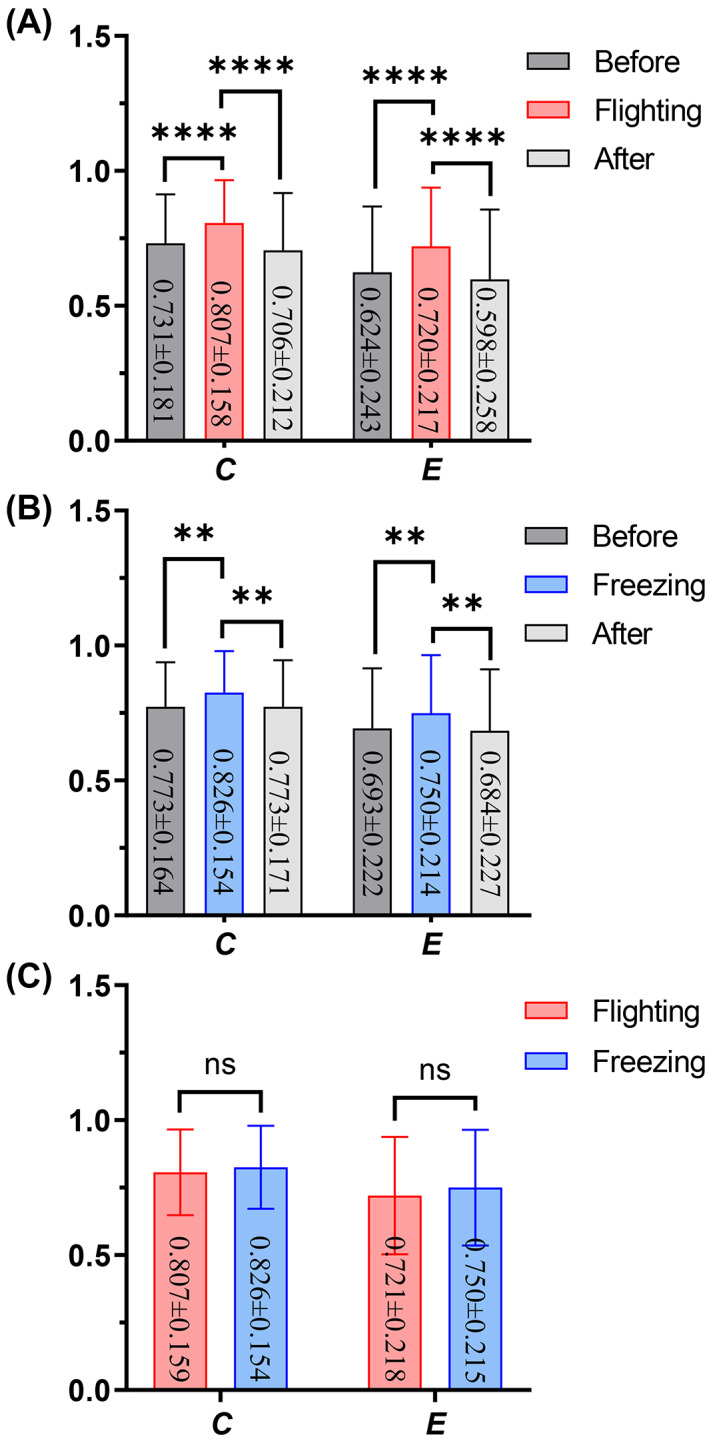
FIGURE 8.

Changes in network topology characteristics under two defensive behaviors. (A) Feature changes when flight behavior occurs. (B) Feature changes when freeze behavior occurs. (C) The contrast in network features between flight and freezing. Two‐way ANOVA (analysis of variance) and multiple comparisons were used for the analysis of differences between groups; **p < 0.01, ****p < 0.0001, and the data are expressed as mean ± SD.
