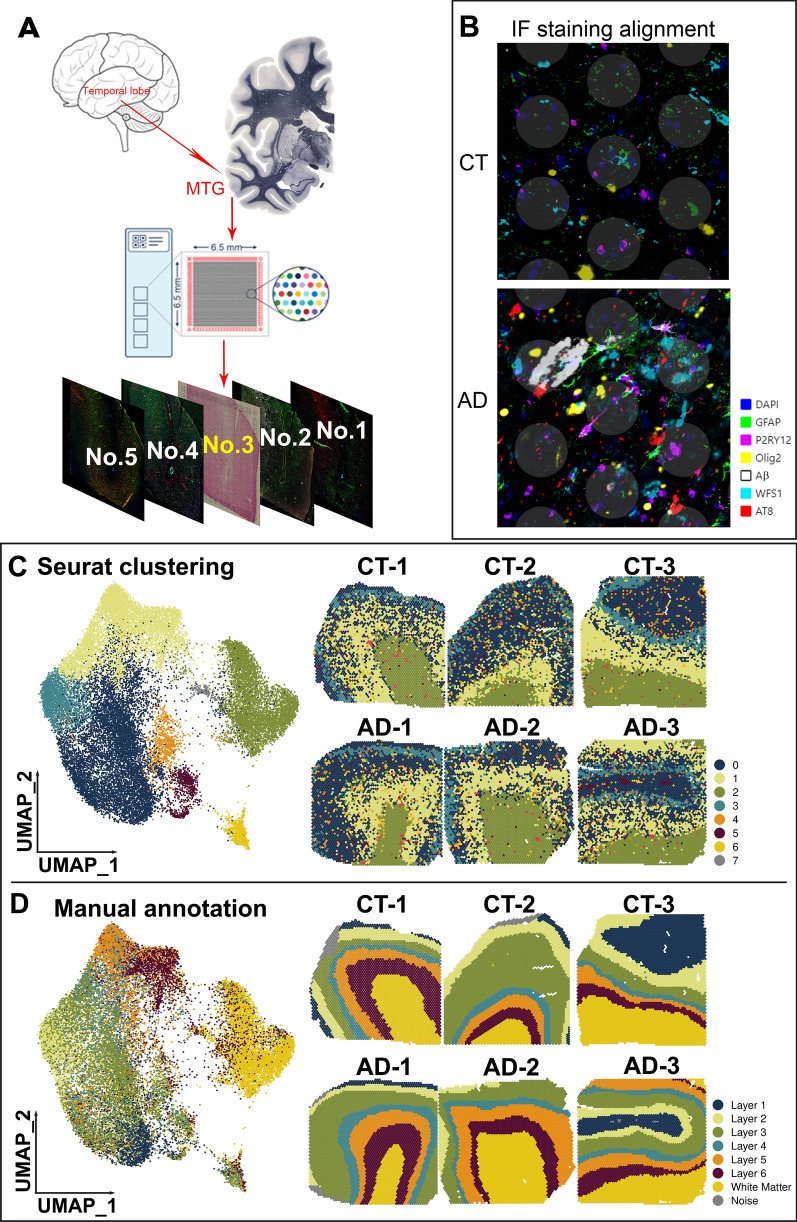
Fig. 1.
Spatial transcriptomics (SRT) of the human middle temporal gyrus (MTG). (A) Sequential 10 µm sections of control (CT) and Alzheimer (AD) MTG brain regions were used for all experiments. The middle section (No. 3) was used for SRT on the Visium platform, and the four adjacent sections (No.1, 2, 4, 5) were used for immunofluorescence (IF) staining. (B) Aligned image of SRT with IF staining of nuclei (DAPI, blue) and cell-type specific markers (GFAP (green), P2RY12 (purple), Olig2 (yellow), WFS1 (teal)) and AD pathological hallmarks (Aβ plaques (white) and AT8 + pathological tau (red)). (C) Uniform manifold approximation and projection (UMAP) plots show eight clusters (0–7) were identified by the Seurat integration framework using Visium spots from both CT (CT-1, CT-2 and CT-3) and AD (AD-1, AD-2 and AD-3) human MTG. The right panel shows spatial maps of the eight clusters for each individual sample generated from Seurat clustering. (D) Manual annotation of six cortical layers and the adjacent white matter (WM). The left panel figure shows the manually labeled spots (six cortical layers and the WM) on UMAP space based on the Seurat integration framework. The right panel of the spatial maps show the localization of the manually labeled spots for each individual sample. Noise, spots with tissue loss or folded regions

