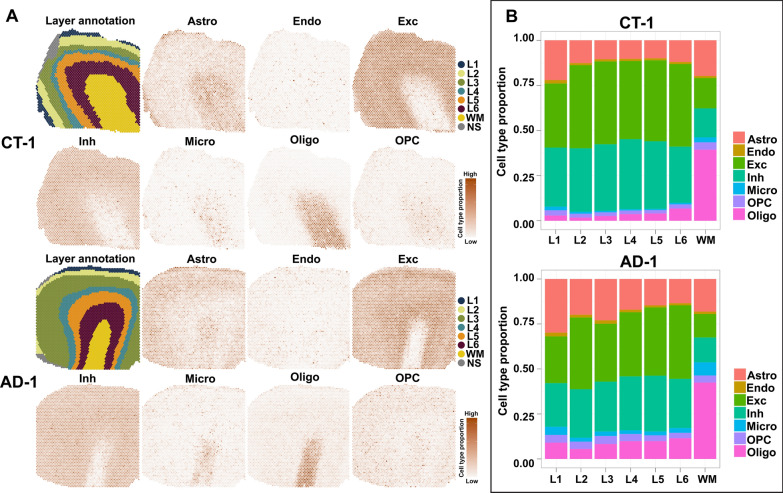
Fig. 3.
Cell type deconvolution analysis of snRNA-seq data and Visium SRT data from human MTG. (A) Manual annotations of six cortical layers and the adjacent WM in CT (CT-1) and AD (AD-1) human MTG, and spatial maps of the cell-type-specific distributions of seven main cell types (Astro, Endo, Exc, Inh, Micro, OPC and Oligo) [37] among spots and layers corresponding to these two cases using Cell2location (see details in Methods). Spots enriched for each cell subpopulation are shown in brown, which is divided into high and low expression based on the proportion of each individual cell subpopulation. (B) Stack bar plots highlight the proportion of seven main cell types in layers I-VI (L1-L6) and the adjacent WM of CT-1 and AD-1. NS, noise spots; Astro, astrocytes; Endo, endothelial cells; Exc, excitatory neurons; Inh, inhibitory neurons; Micro, microglia; Oligo, oligodendrocytes; and OPC, oligodendrocyte precursor cells

