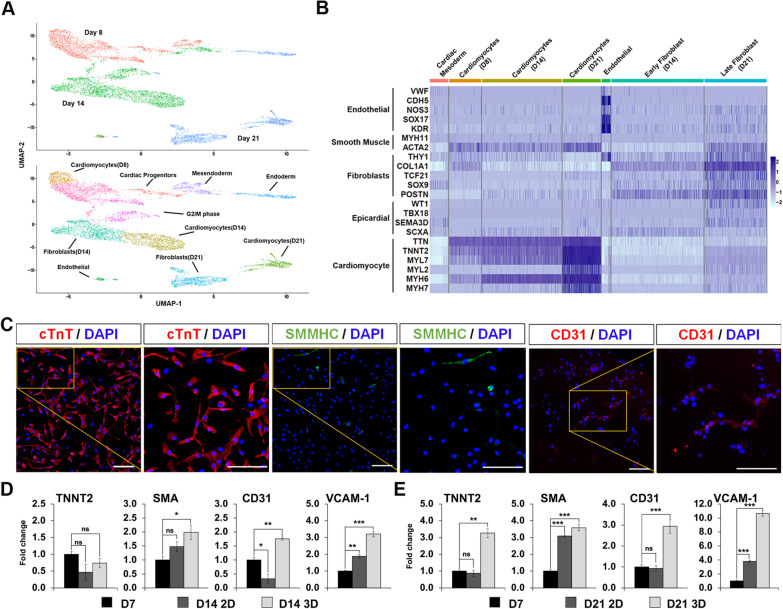
Fig. 3.
Chambered cardiac organoids are composed of cell types from the various cardiac lineages. A Uniform manifold approximation and projection (UMAP) of all cells, representing distinct identities of cells in day 8, day 14 and day 21 CCOs (top). UMAP revealed ten main cell clusters within the three time points (bottom). B Gene expression levels of the identified seven clusters related to the cardiac lineage are isolated in this heatmap. Each cluster identified is expressing their own marker genes. The singular endothelial cell cluster contains cells from all three timepoints of the organoids. C Representative confocal immunofluorescence image showing expression of cardiomyocyte, smooth muscle cell and endothelial cell lineage specific markers in the dissociated CCOs. Scale bars, 100 µm. D–E Quantitative RT-qPCR gene expression comparison of 2D cultured cardiomyocytes and 3D cardiac organoids of day 14 (D) and day 21 (E), normalized to day 7 cardiomyocytes. Genes shown represent markers of cardiomyocyte, smooth muscle and endothelial cell lineages (n = 3; mean ± s.e.m; housekeeping gene, ACTB; ***P < 0.001; **P < 0.01; *P < 0.05; two-tailed Student’s t test)

