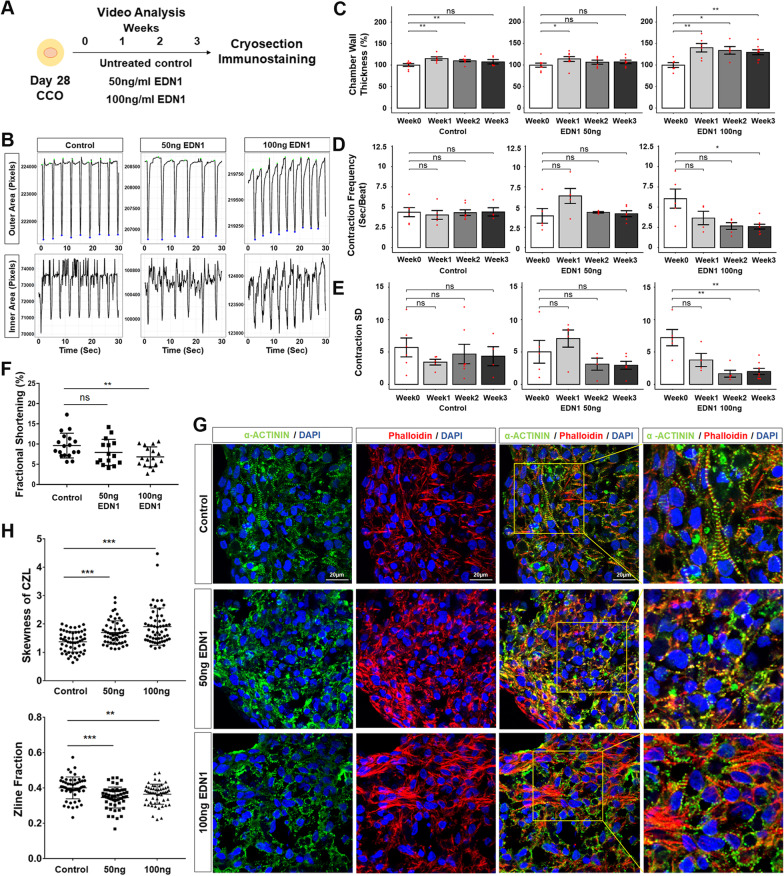
Fig. 5.
Cardiac hypertrophic phenotypes are recapitulated in chambered cardiac organoids treated with CH inducer EDN1. A Schematic diagram for cardiac hypertrophy modelling. B Outer (top) or inner (bottom) area against time plot of representative videos from a single CCO of each treatment condition. C–E Quantification of changes to chamber wall thickness normalized to Week 0 (C), contraction frequency (D), contraction standard deviation (E) across the time points. Each chart represents one treatment condition (Left: Control; Middle: 50 ng/ml EDN1; Right: 100 ng/ml EDN1). Each red dot represents one organoid sample analysed (n = 4–6 organoids per condition; mean ± s.e.m; Mann–Whitney U test). F Blind analysis of fractional shortening (%) in CCOs on the third week of treatment (Control n = 18, 50 ng/ml EDN1 n = 15, 100 ng/ml EDN1 n = 17; mean ± s.e.m; Welch’s t test). G Representative confocal immunofluorescence for z-line analysis of each condition at the end of Week 3. Scale bars, 20 µm. H Zline skewness (left) and Zline fraction (right) parameters are significantly affected in treated CCOs (n = 55 sections per group; mean ± s.e.m, Welch’s t test). In (C–H), significance is presented as ***P < 0.001; **P < 0.01; *P < 0.05

